DataVis – Exploring DeviantArt (Summary)
ICAM130 Data Visualization Series: This is a series of visualizations created during related courses and independent research at UCSD.
Exploring DeviantArt Series: A series of visualisations exploring art, an expression of human creative skill and imagination in varying mediums, through the lens of the online deviantArt community.
Exploring DeviantArt
Summary
Art is a vast and ever-intriguing phenomenon. There are many ways to explore artistic creations and the communities surrounding the endevour. As a collective, it can be visualised with time, as constellations of clusters, as abstracted agents, and via human-defined categories. This project is an attempt to gleam some insight from artistic works when considered within the creative community that is DeviantArt.
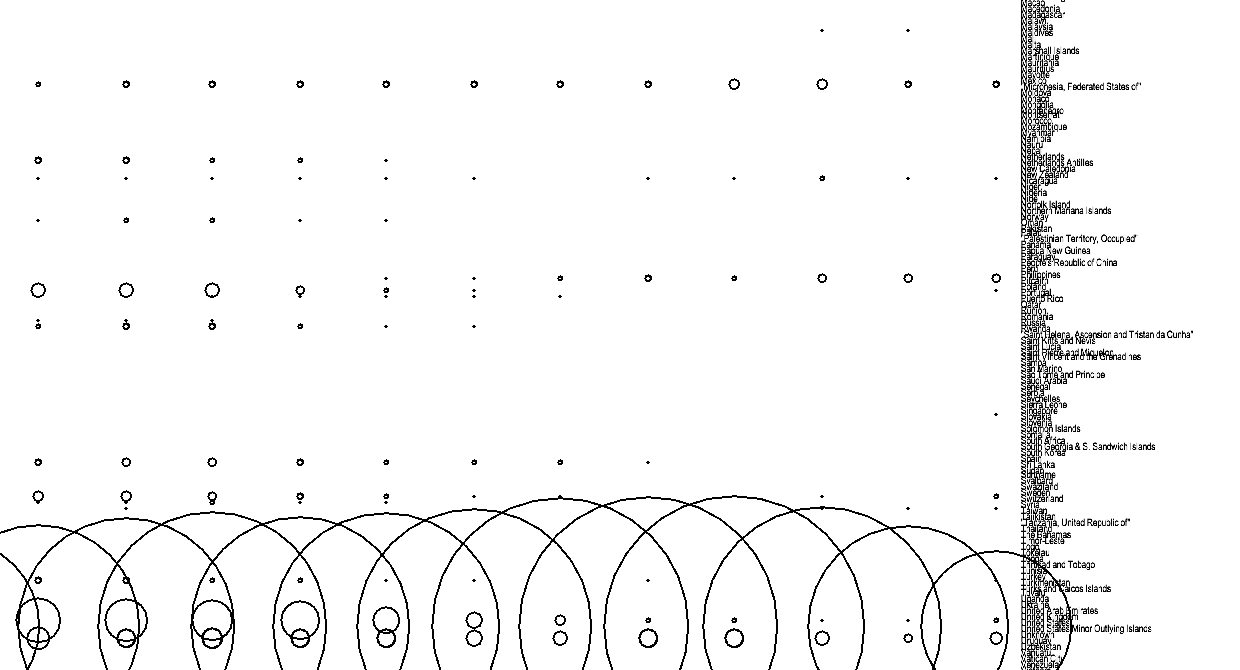
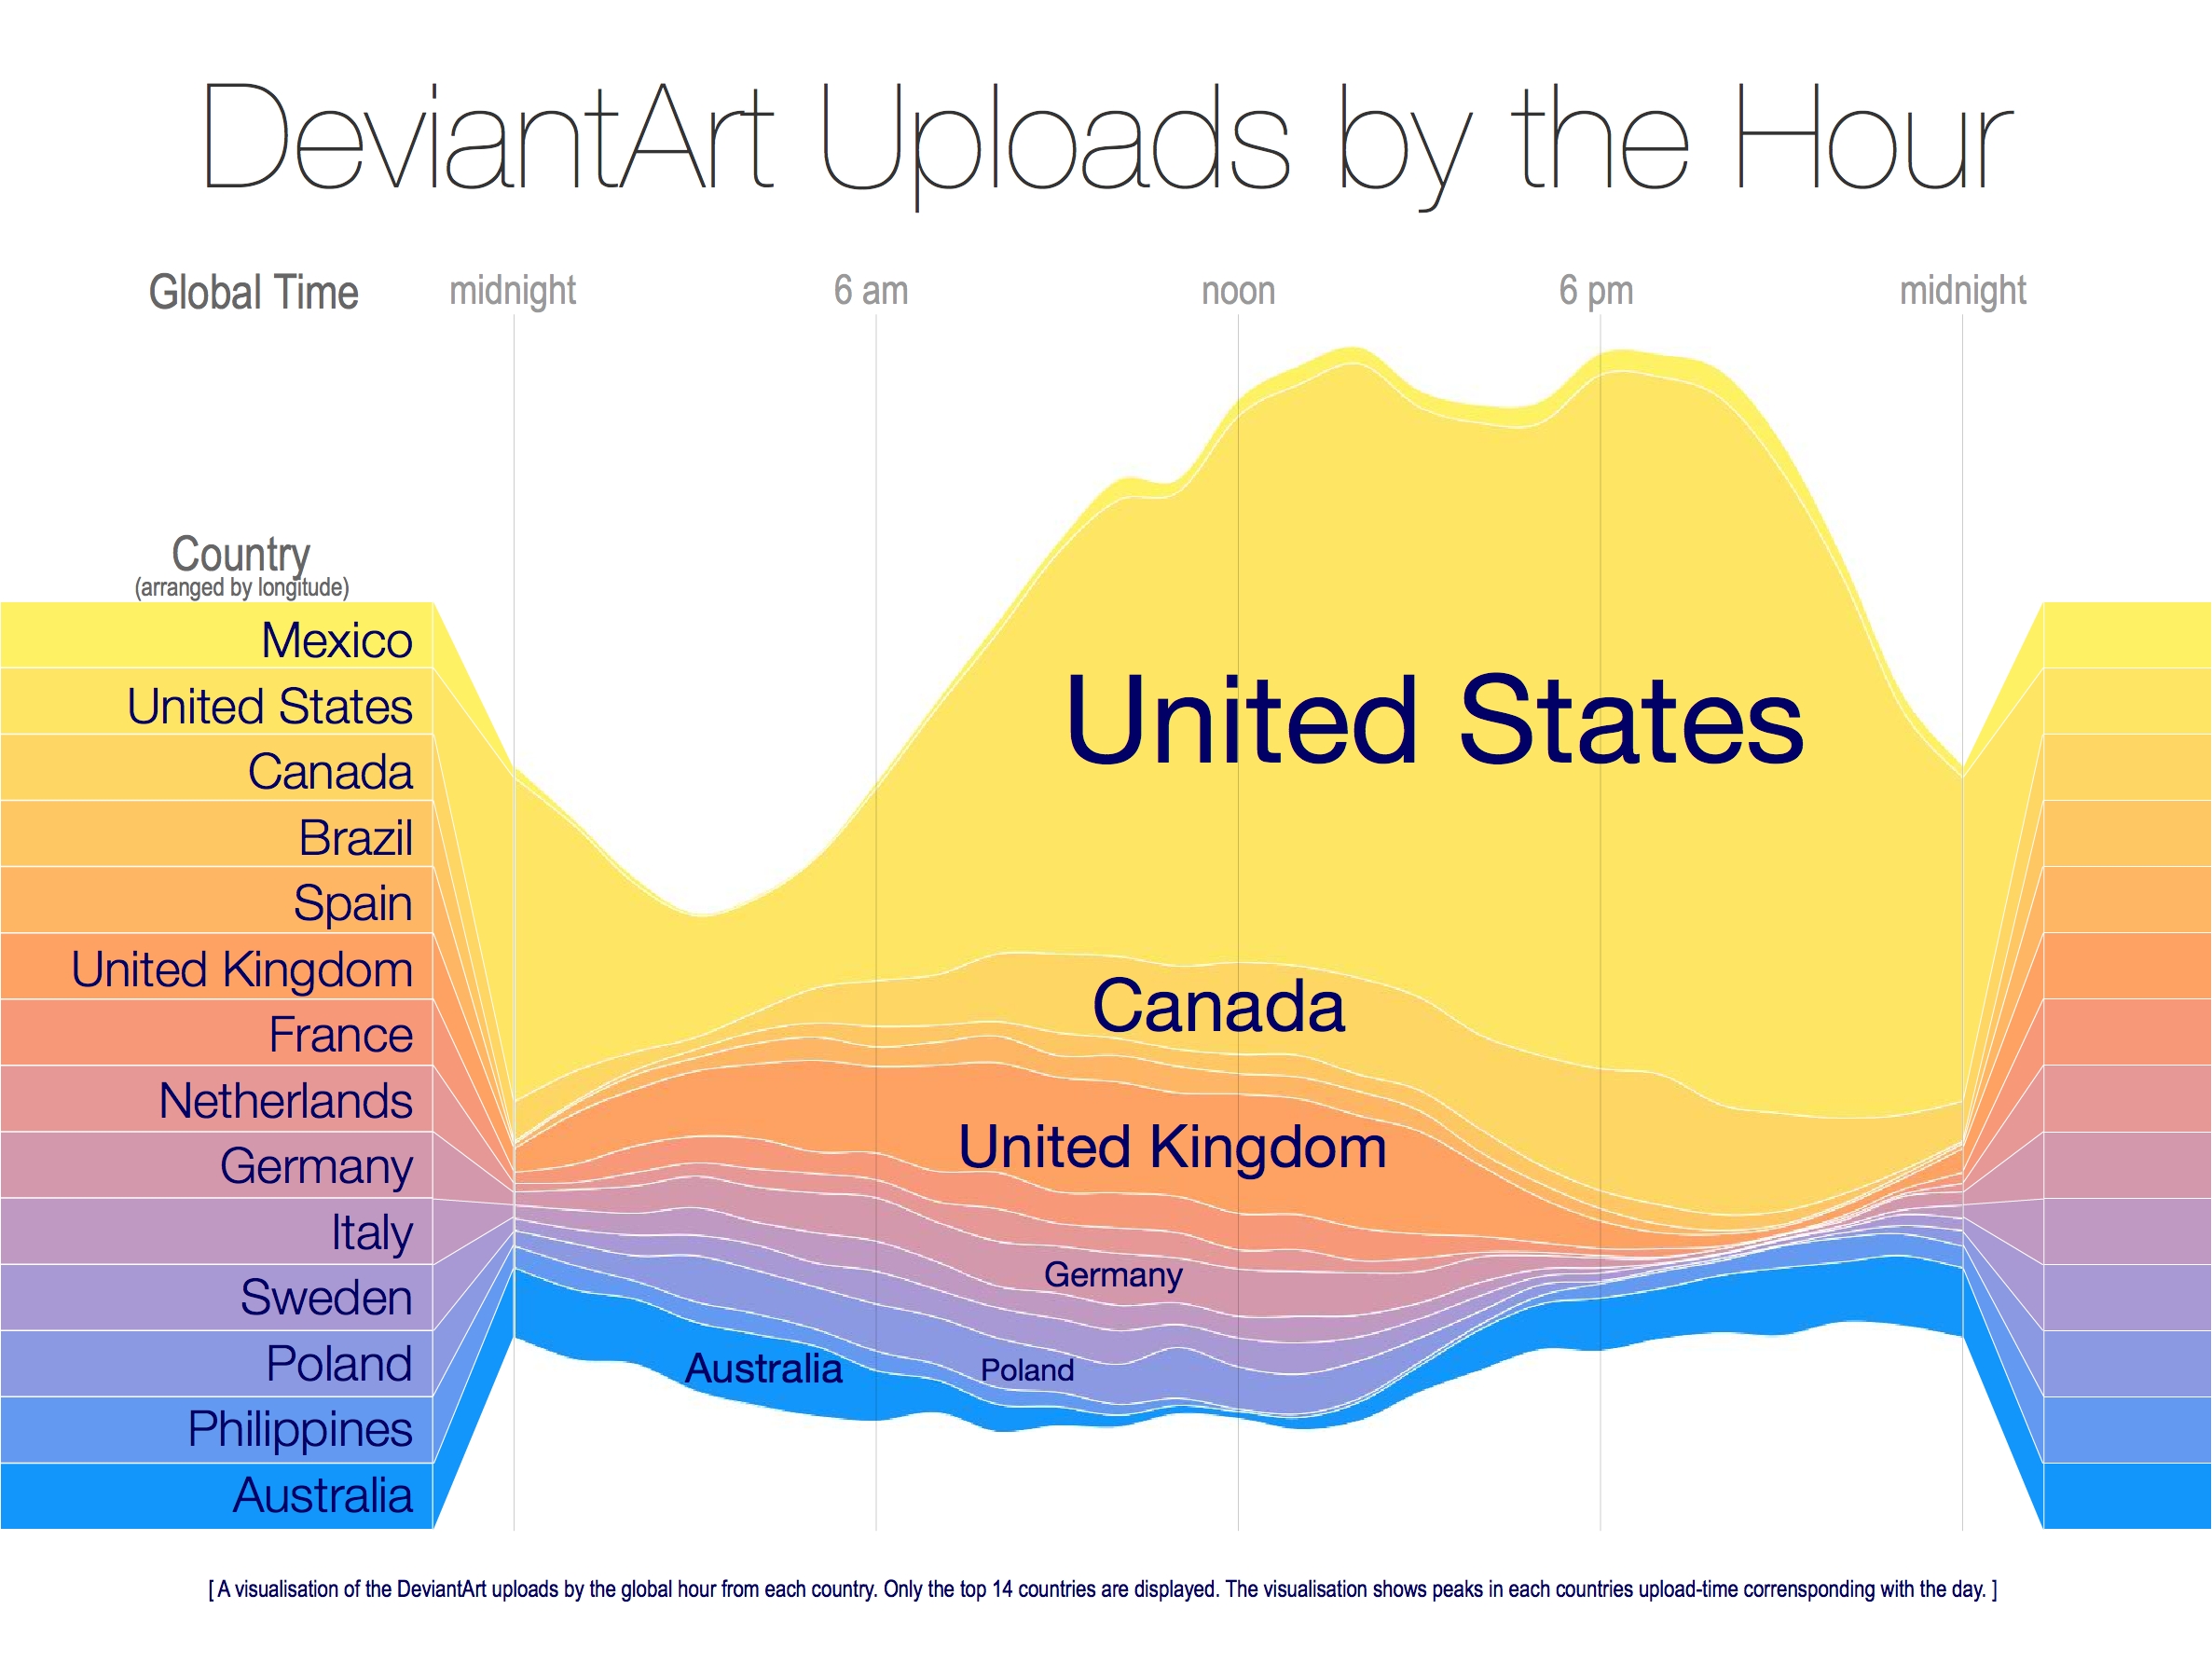
By Country and Time
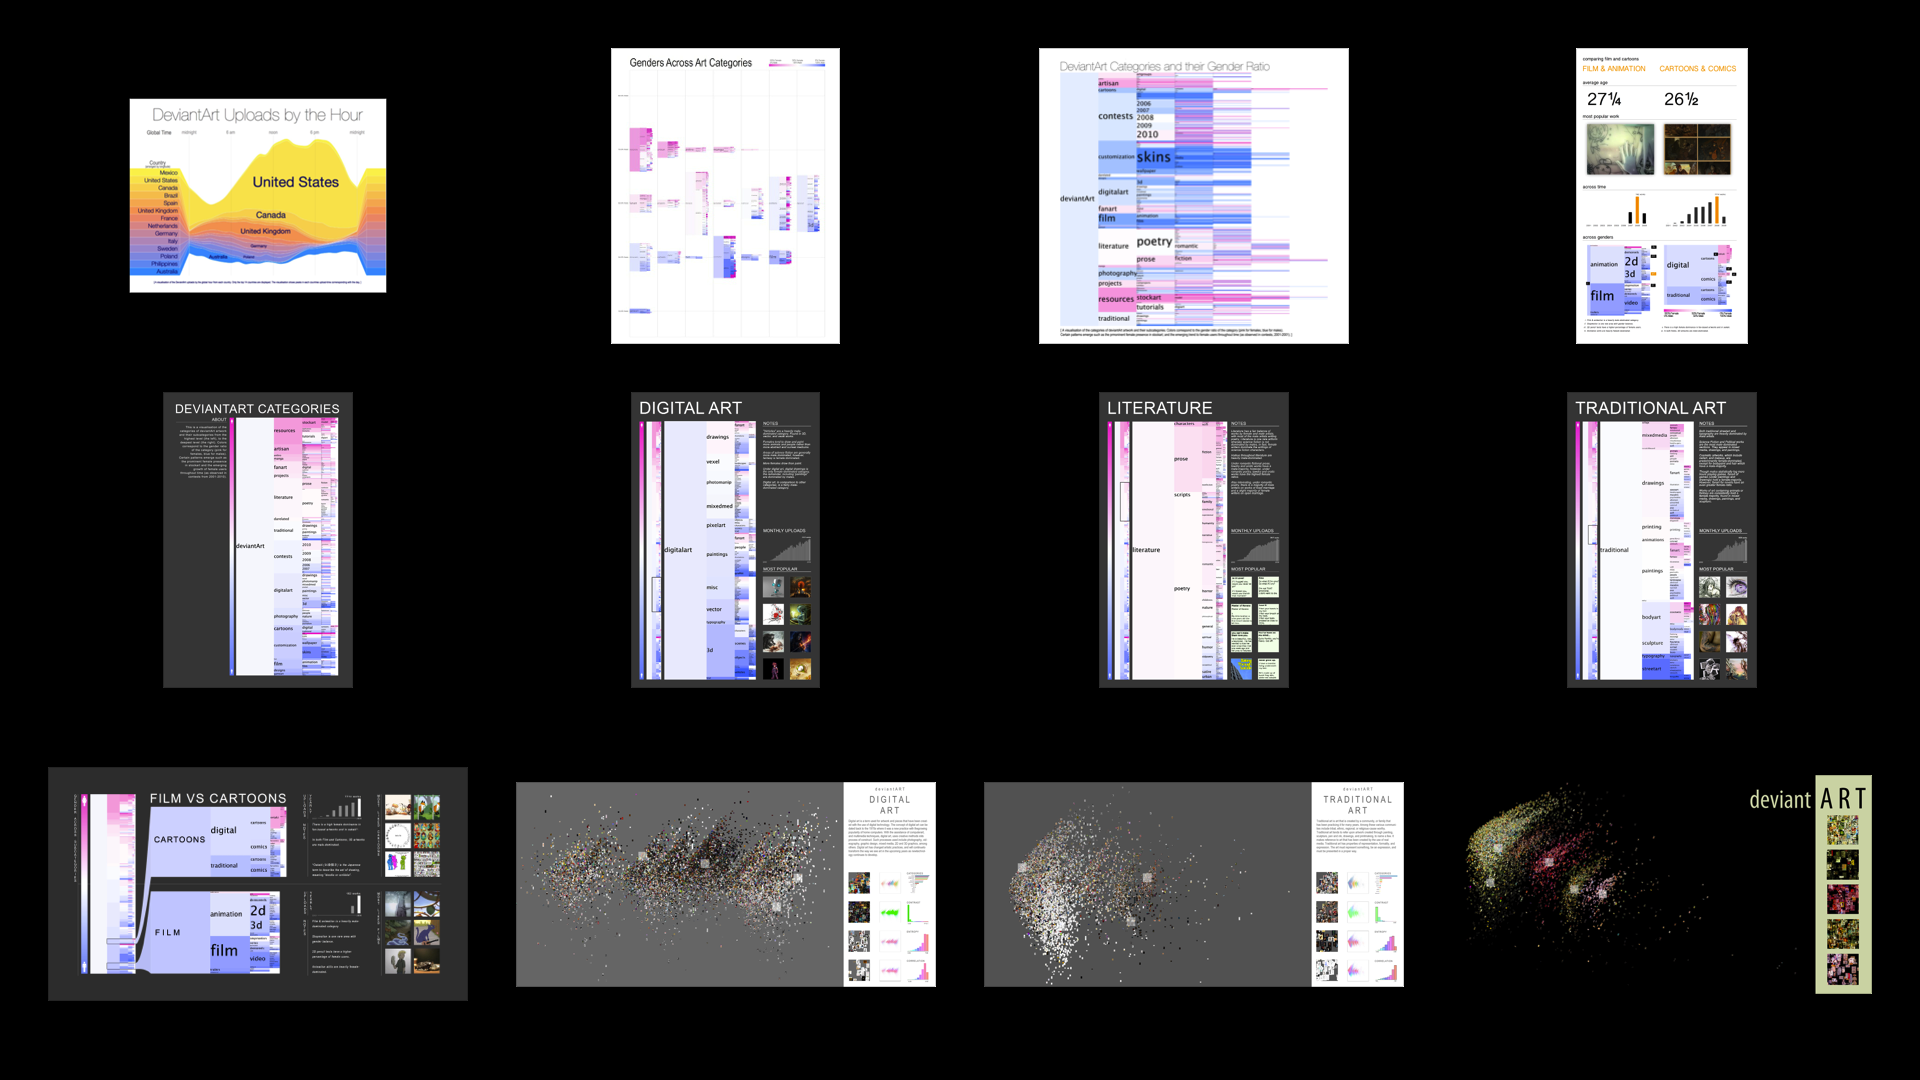
One of the DeviantArt explorations involved looking at when different countries posted artworks. Early explorations were quite abstract. Gradually it moved onto something more functional and informative.
Images in order of process:
 vs UploadHour.png)
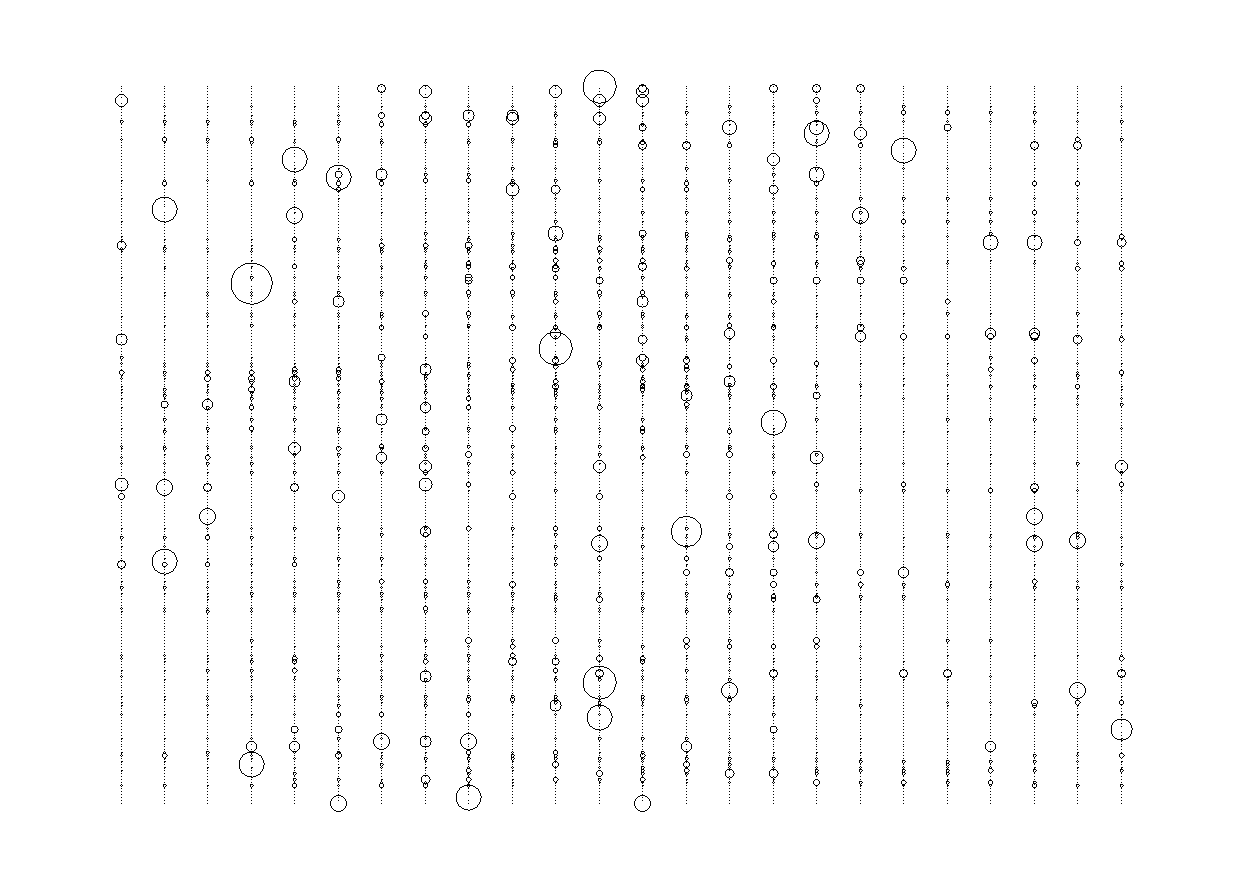
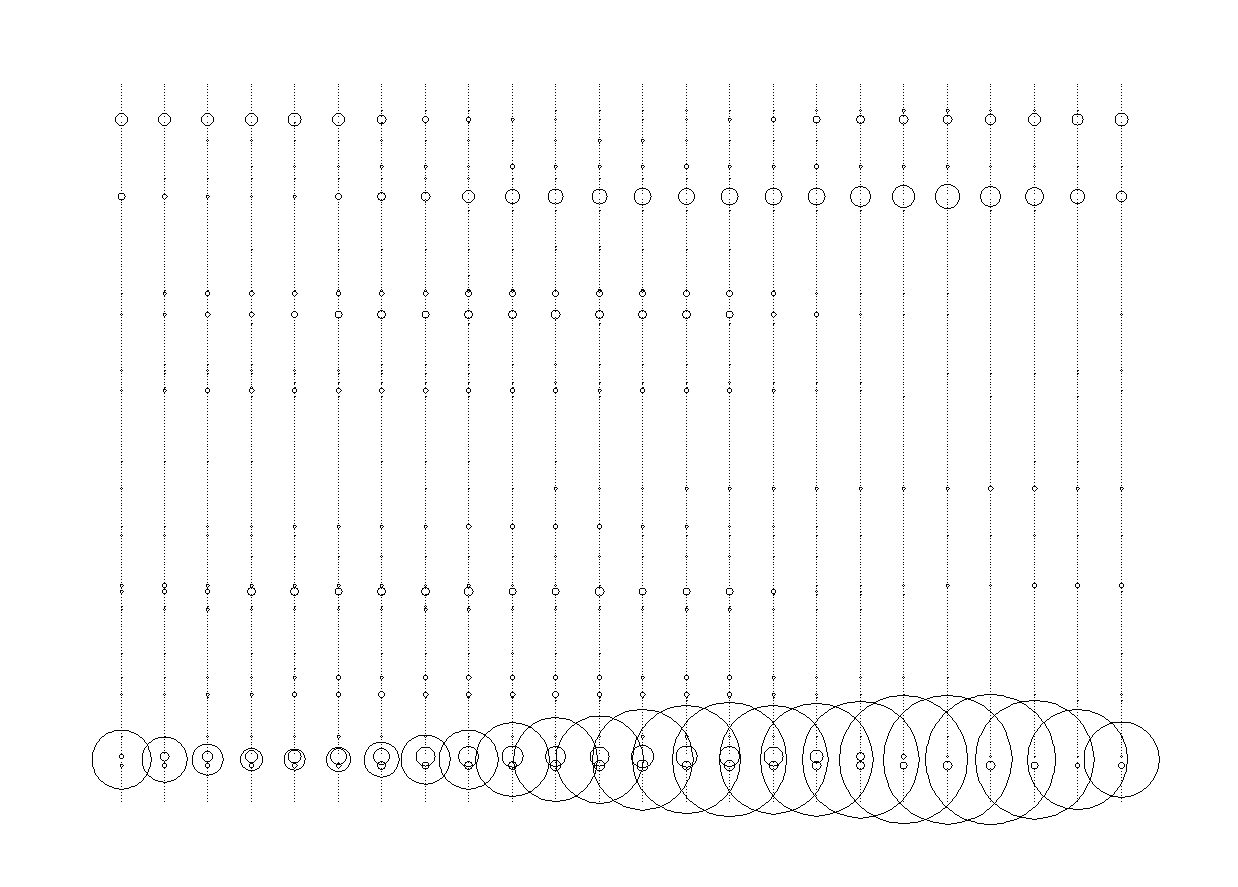
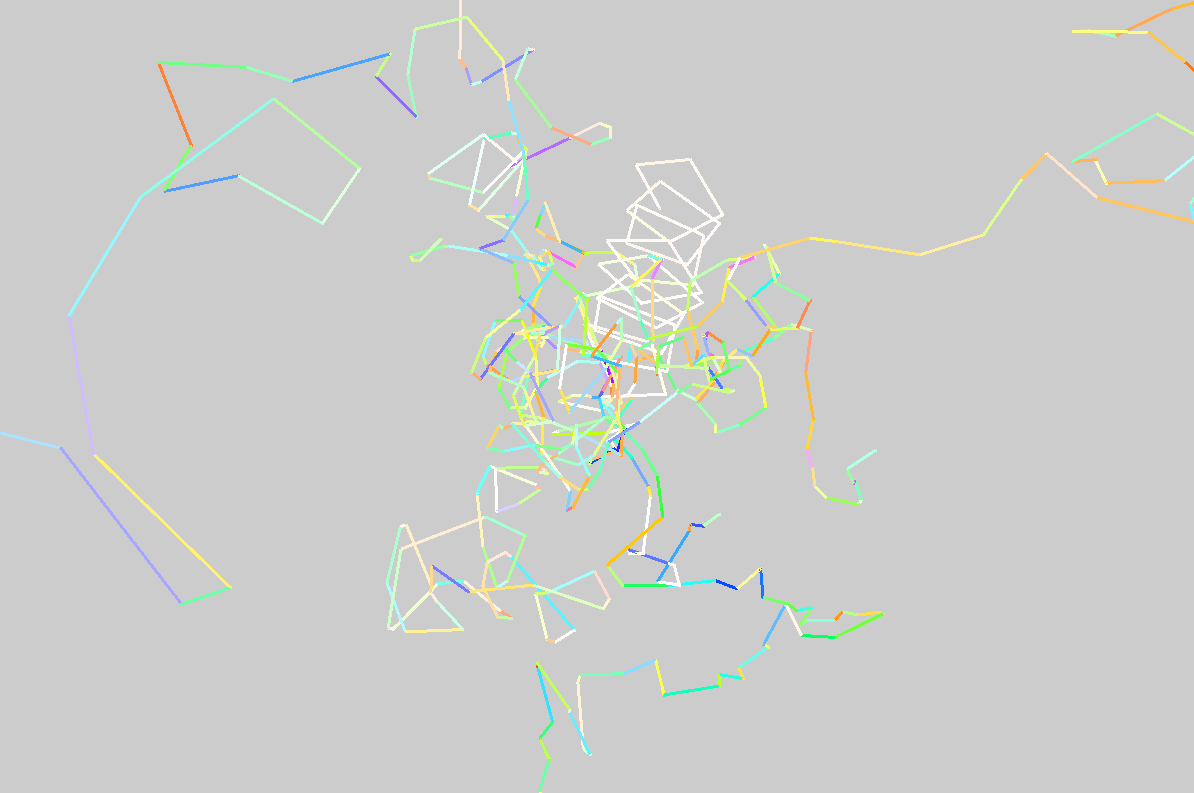
Abstract Agents
A few trials were made at more abstract representations of the data. Whilst interesting, they were paused in favour of being more easily lead by the constraints offered by slightly more functional visualisations.
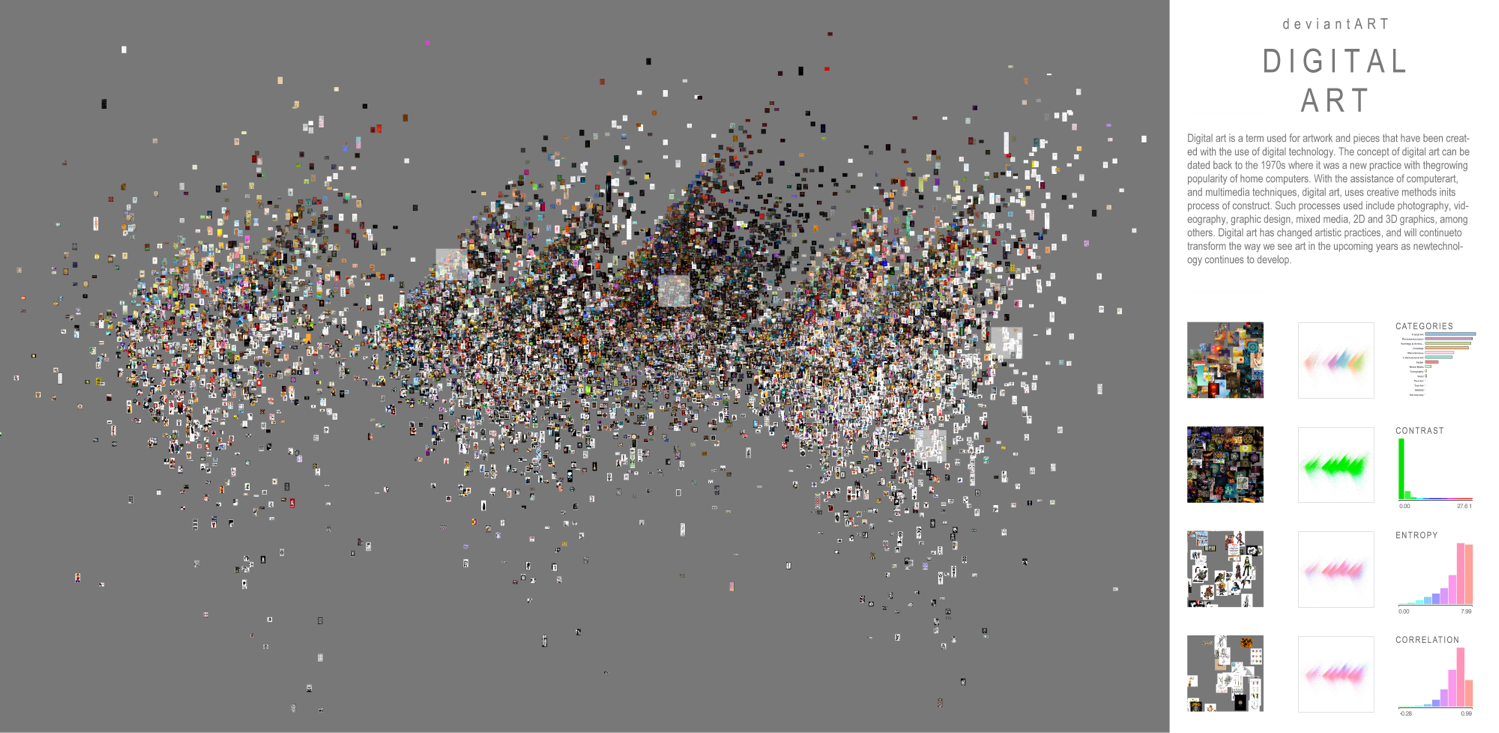
Artwork Clusters
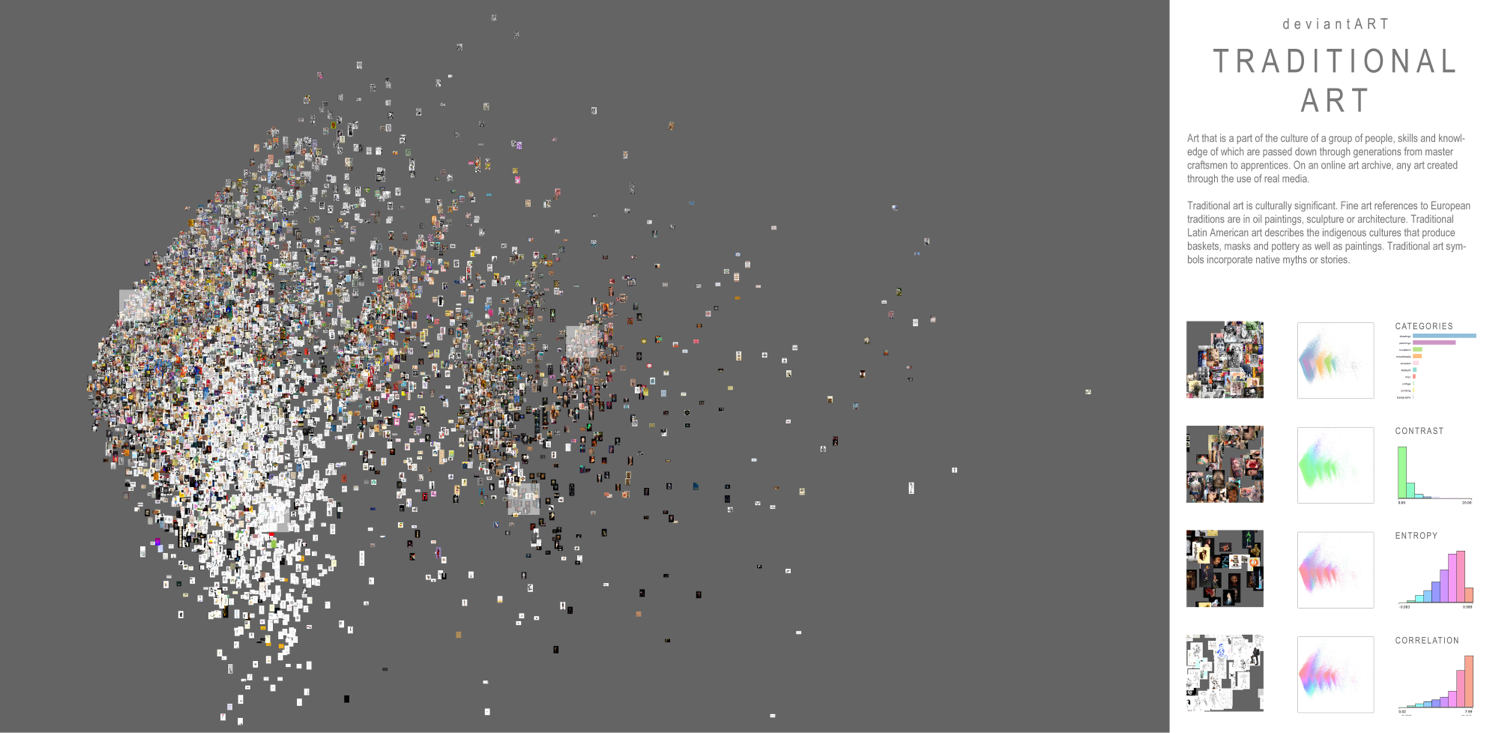
DeviantArt Artworks were also clustered by visual characteristics. The full report can be read here.
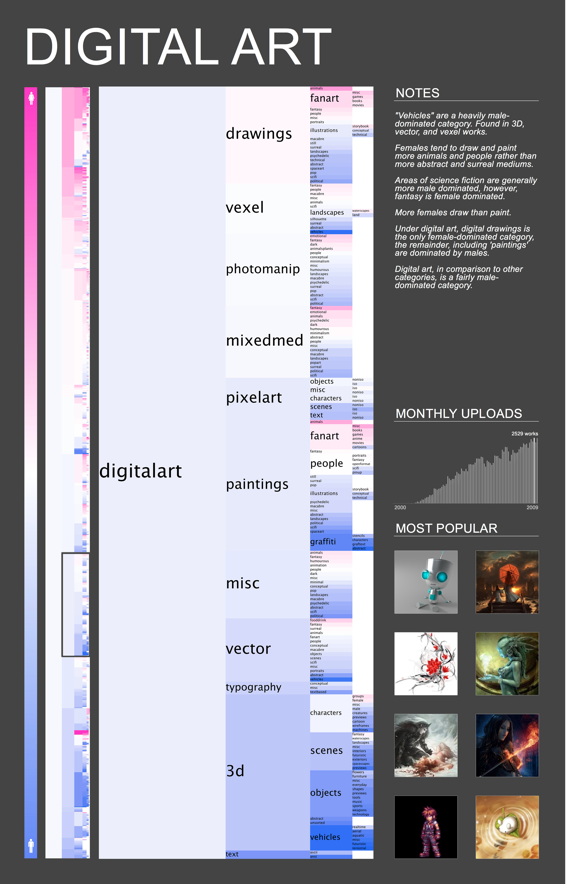
Artwork Categories
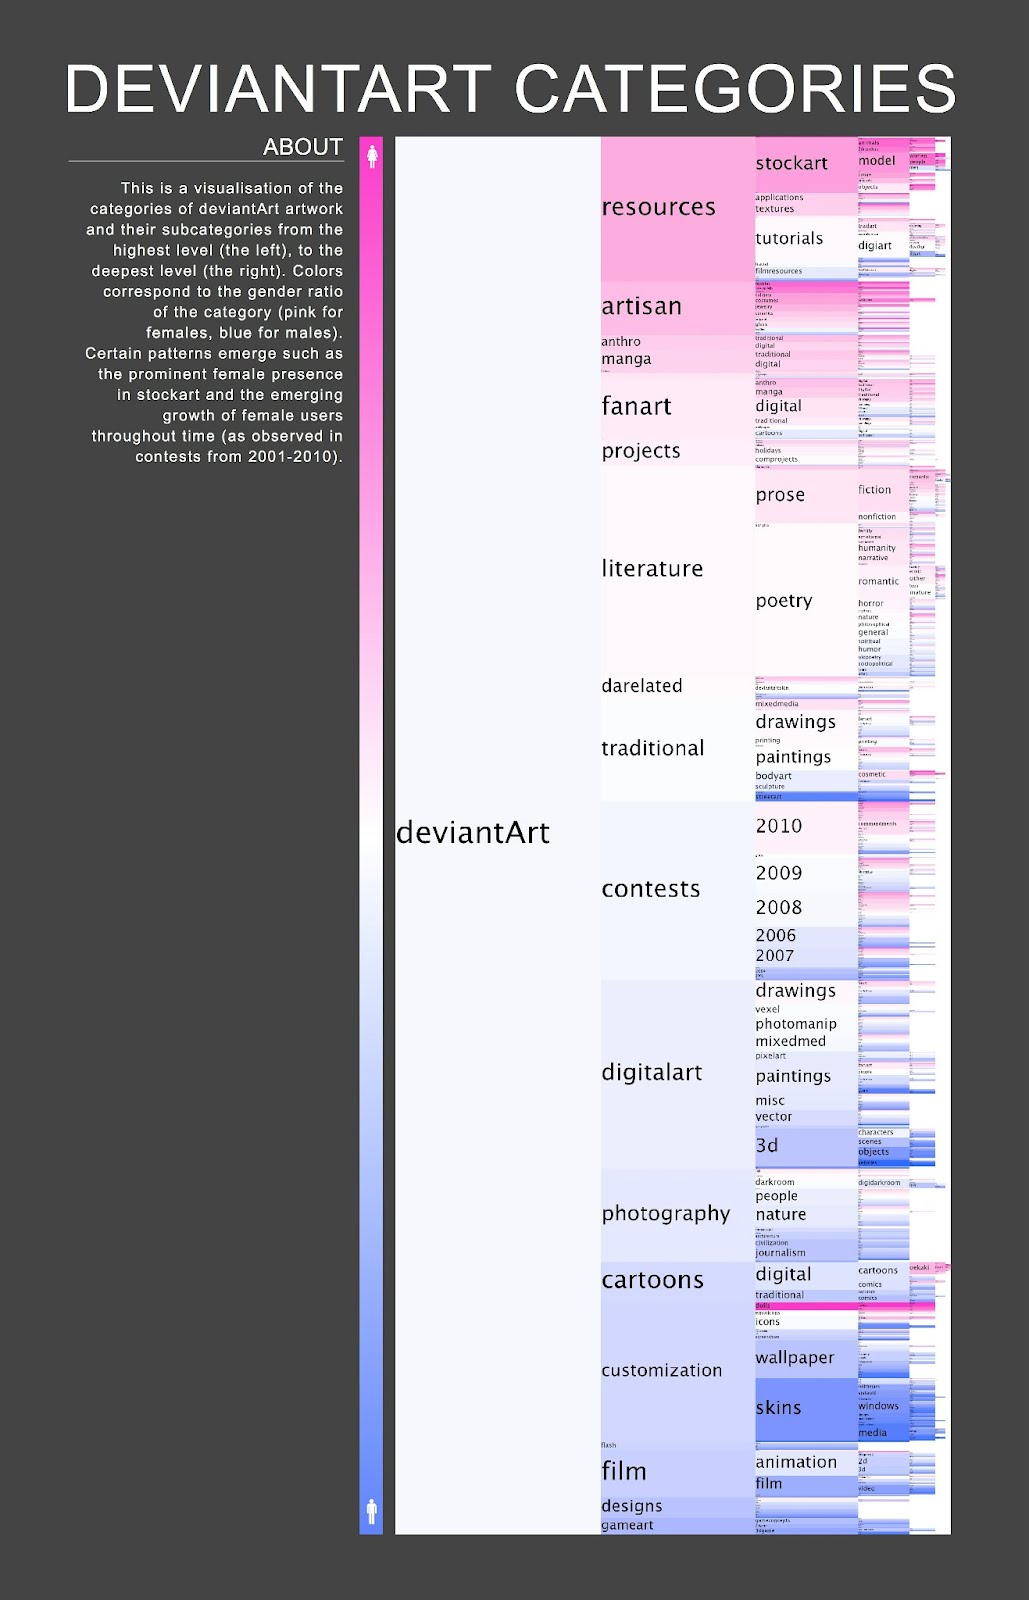
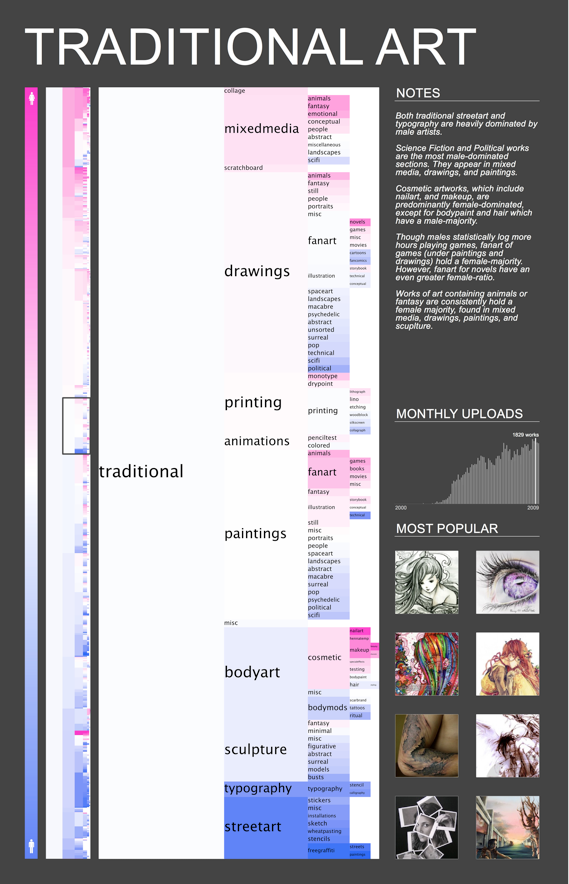
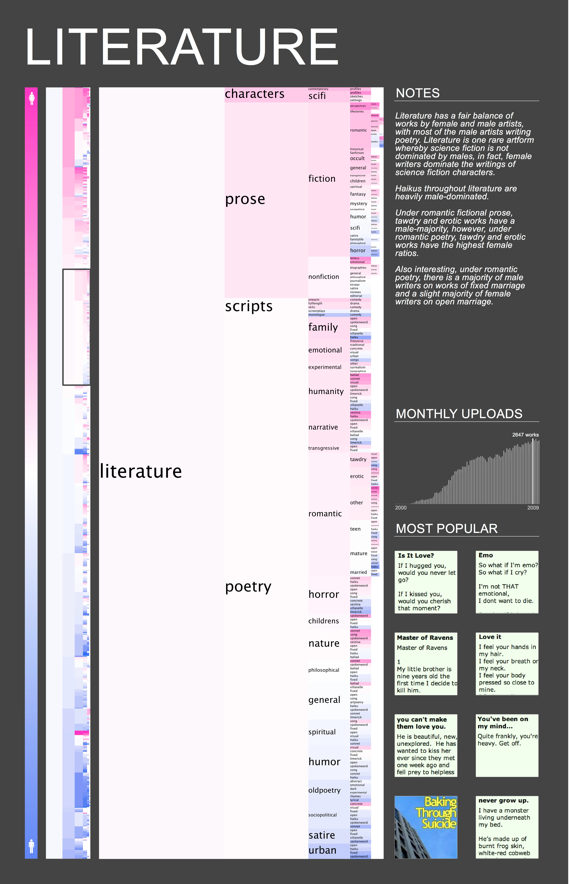
DeviantArt Categories also proved very interesting, especially along the axis of gender ratio and their evolution over time. The full report can be read here.
Conclusions
The wealth of insights that can be mined from human and cultural collections such as DeviantArt are invaluable - allowing us to identify and weave stories about the society they represent.
In addition to DeviantArt data, it has also been great to simultaneously explore other visual datasets such as Marvel Comics and the Cooper Hewitt Museum data.
This work was presented at the ‘Best of ICAM’. [PDF Slides]
I’ve learnt so much from this time in Data Visualisation. It truly is a beautiful union between the technical side of data mining and processsing, and the synthesis of information into comprehensive and aesthetic visualisations. Visualisation is one of the rare few fields that offer a perfect union between the technical, cognitive, and aesthetic.
Thanks
Many thanks to Lev Manovich, Jay Chow, Bradley Schnell, and Teenah Eco - whom have been invaluable mentors and amazing collaborators.