DataVis – Clustering DeviantArt Artworks (Report)
ICAM130 Data Visualization Series: This is a series of visualizations created during related courses and independent research at UCSD.
Exploring DeviantArt Series: A series of visualisations exploring art, an expression of human creative skill and imagination in varying mediums, through the lens of the online deviantArt community.
This is a report on the findings made from exploring the clusters inherent to DeviantArt artworks.
CLUSTERING DEVIANTART ARTWORKS
Introduction
Art is the expression of human creative skill and imagination. It incorporates many traditional creative practices, such as painting, literature, sculpting, and many more recent digital forms from 3d artworks to film and pixel art. The web has allowed artists an even greater domain to express themselves to a larger audience. Not only that, the web connects artists amongst their peers and viewers, and carries with it memes and cultural influences that effect, and are affected by, artists.
DeviantArt, or dA as it is known by its online community of 19 million artists, was first launched in 2000, and has since grown to be the 13th largest social network (as of July 2011). It receives over 100,000 daily uploads of original artworks, spanning it’s vast tree of categories and subcategories (over 1700), from stock art of aquatic animals, to silkscreen printing, and comedic films.
Our core dataset was provided by Lev Manovich’s Software Studies lab, it consists of a small sampling of deviantArt artworks and their associated metadata (such as an artist’s artwork, date of publication, title, etc.). These artworks can also be analyzed for histograms and means of their color-variables as well as other variables such as contrast.
With this dataset, we can filter, explore, and perform additional algorithms on it to generate visualisations that can reveal cultural visual patterns.
Process
On acquiring data for digital art and traditional art, we used Mondrian to explore their features, and metadata. With the help of ‘R’, principal component analysis was used to create abstracted clusters of images that were grouped together based on similarity. However, many different clusters can be created in accordance to what parameters the algorithm determines to hold greater weight. Hence, histograms of different image-parameters (e.g. contrast) were color-coded, and the image clusters that showed the most consistent variance in color-ranges across histograms were chosen.
It was thought that images of the same category should also cluster together, hence, the top-level of an artwork was extracted and used to help calculate the image clusters.
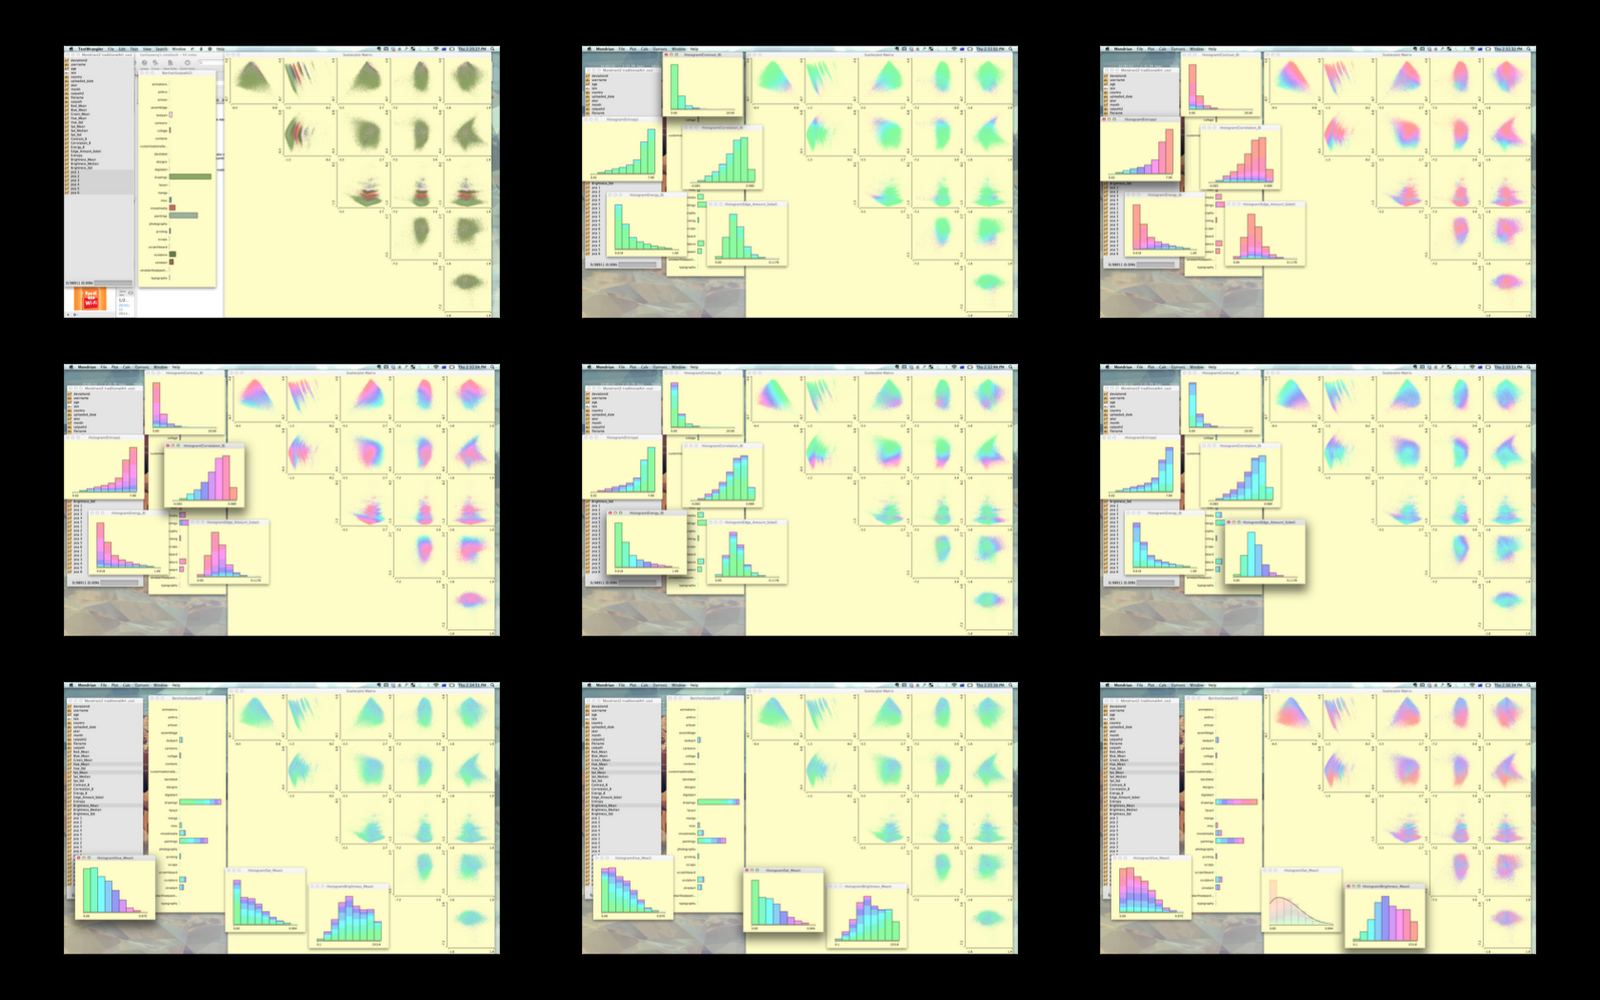
Figure 1. (In each image of the nine) A snapshot is shown of the many types of image clusters that can be generated, and (across the nine images) the way different variables can be dispersed across different clusters.
Once the image clusters were determined, it was a matter of visualising them, choosing the most appropriate one, and designing appropriate aesthetics around them.
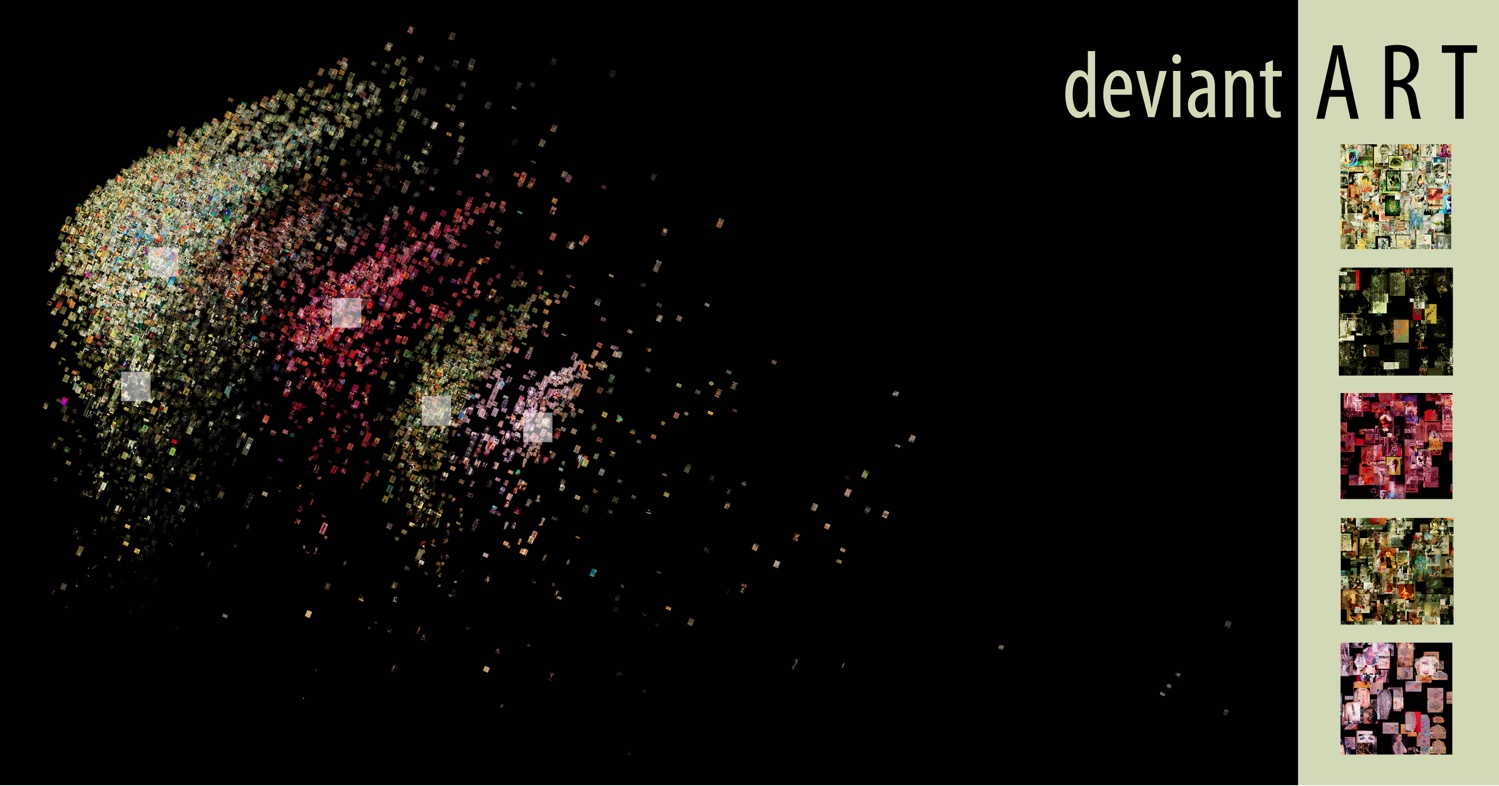
Figure 2. An early visualisation of an image cluster of traditional artworks, colour-coded to differentiate different categories.
Image Clusters of Digital & Traditional Artwork
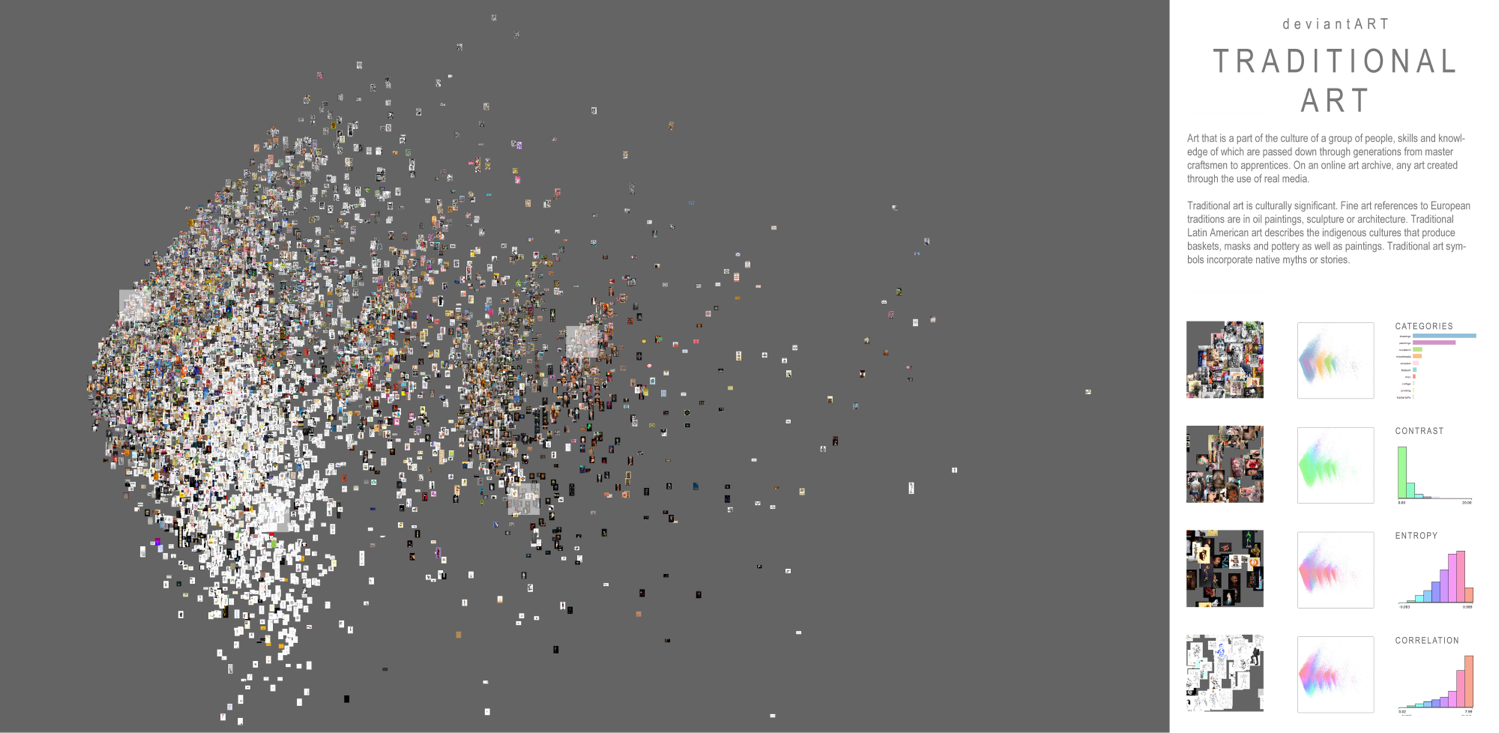
Figure 2. An imageplot of traditional artworks. Similar images (determined by their contrast, correlation, energy, edges, entropy, and category) are closer together.
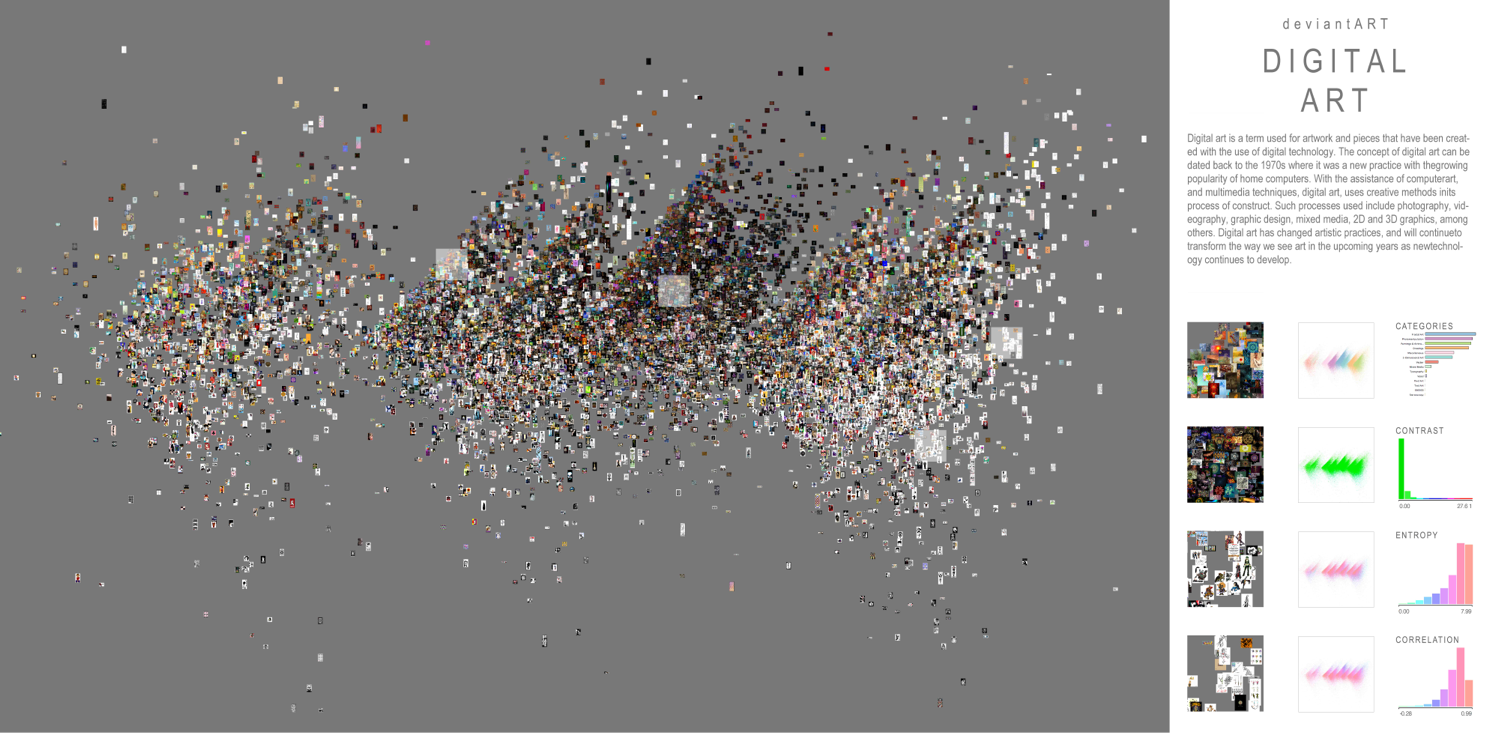
Figure 3. An imageplot of digital artworks. Similar images (determined by their contrast, correlation, energy, edges, entropy, and category) are closer together.
Two final posters of traditional deviantArt artwork (figure 2) and digital artwork (figure 3) were generated from the aforementioned clustering technique and ImagePlot (a visualisation program from the Software Studies Lab). The same abstracted variables (Principal component analysis (PCA 3 and PCA 4) were used with both traditional and digital artwork visualizations so that they would retain the same class of shape (which we have attributed to a ancience fish-like trilobite).
The central image is the image plot of images in the specific category of artworks (traditional or digital). The original data file was a sampling of deviantArt artworks, hence, these visualisations do not represent every artwork under their related categories, but a sample of them. On the right, a key provides a brief description of this category of artwork. Thumbnails of distinct areas of the graph are magnified here, (shown as white squares on the main image plot). A basic key is also established by providing thumbs of the graph, colour-coded by the ranges of different parameters such as category, contrast, entropy, and correlation.
At first glance, one finds that digital art is much more dispersed than traditional in it’s use of categories with many more ‘arrow-heads’. Traditional art tends to share many more similarities across its mediums than digital art, drawings and paintings have noticeably similar feature sets, and contribute to the leading cluster of images to the right of the visualisation.
Traditional Art also has much brighter artworks in comparison to digital art, which can easily generate darker artworks (with a dark clustering in fractal art, and its adjacent clusters (photomanipulation and 3-dimensional artwork). While zooming in upon the bright clusters of traditional art, it can be observed that most artwork start off with a white canvas, a traditional starting point that does not carry onto digital artworks.
Becoming immersed in the exploration and generation of image plots, allows for the discovery of trends and patterns across different types of artworks (digital versus traditional) and their subcategories.
Contributions
Hanley Weng – Implementation
Teenah Eco – Aesthetics