DataVis - Exploring Cooper Hewitt Data (Interactive Installation)
ICAM130 Data Visualization Series: This is a series of visualizations created during related courses and independent research at UCSD.
Exploring Cooper-Hewitt Data
An increasing number of museums, such as the “Cooper Hewitt, Smithsonian Design Museum”, are opening up their data to the public. The following is an demonstrative installation where museum visitors can walk through a history of American artworks. It stemmed from an exploration of the potential applications with the Cooper Hewitt data.
Process
Artworks were downloaded and plotted in various configurations. The most interesting clusters were differences in American, Austrian, French, and Italian artworks. Plotted below are their artworks over time (x-axis) and luminance (y-axis).
.jpg)
To be frank, these explorations of such low-level (easy-access) artistic attributes didn’t produce imageplots of any real significance. Hence, an exploration of possible installations was undertaken.
As I was in America at the time, I decided to focus on building a quick conceptual installation in a few hours to showcase American art.
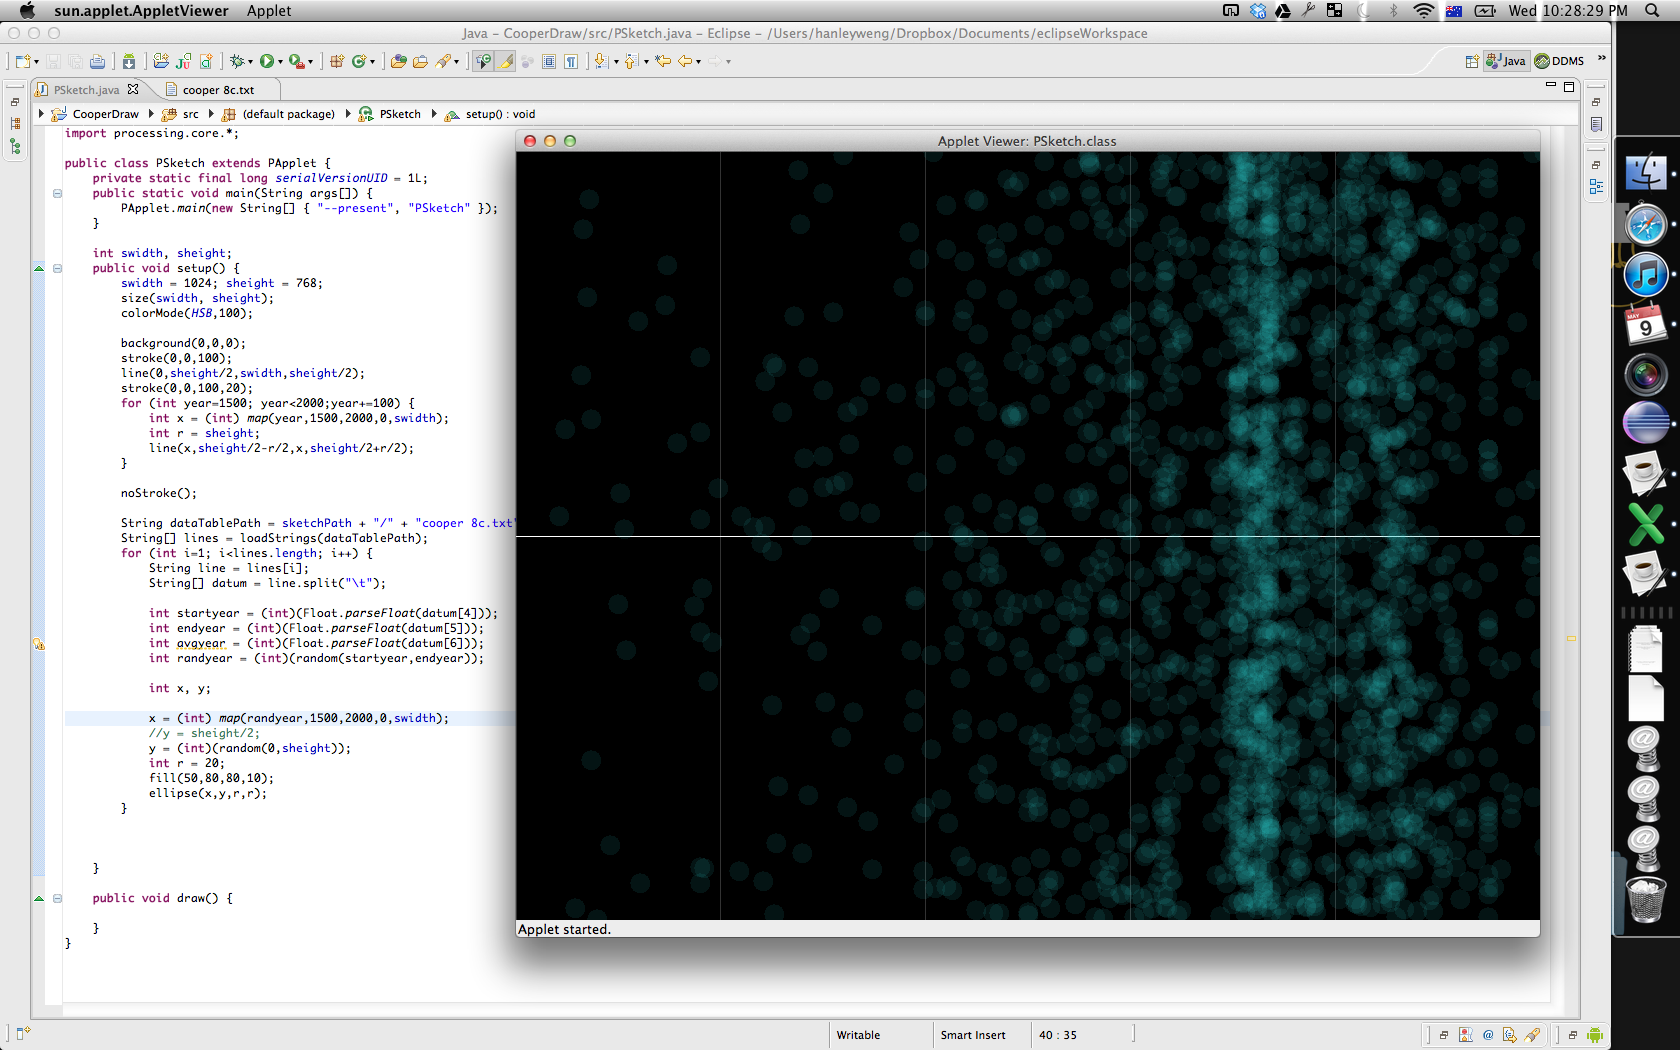
Quick plots of the distribution of artworks were done.

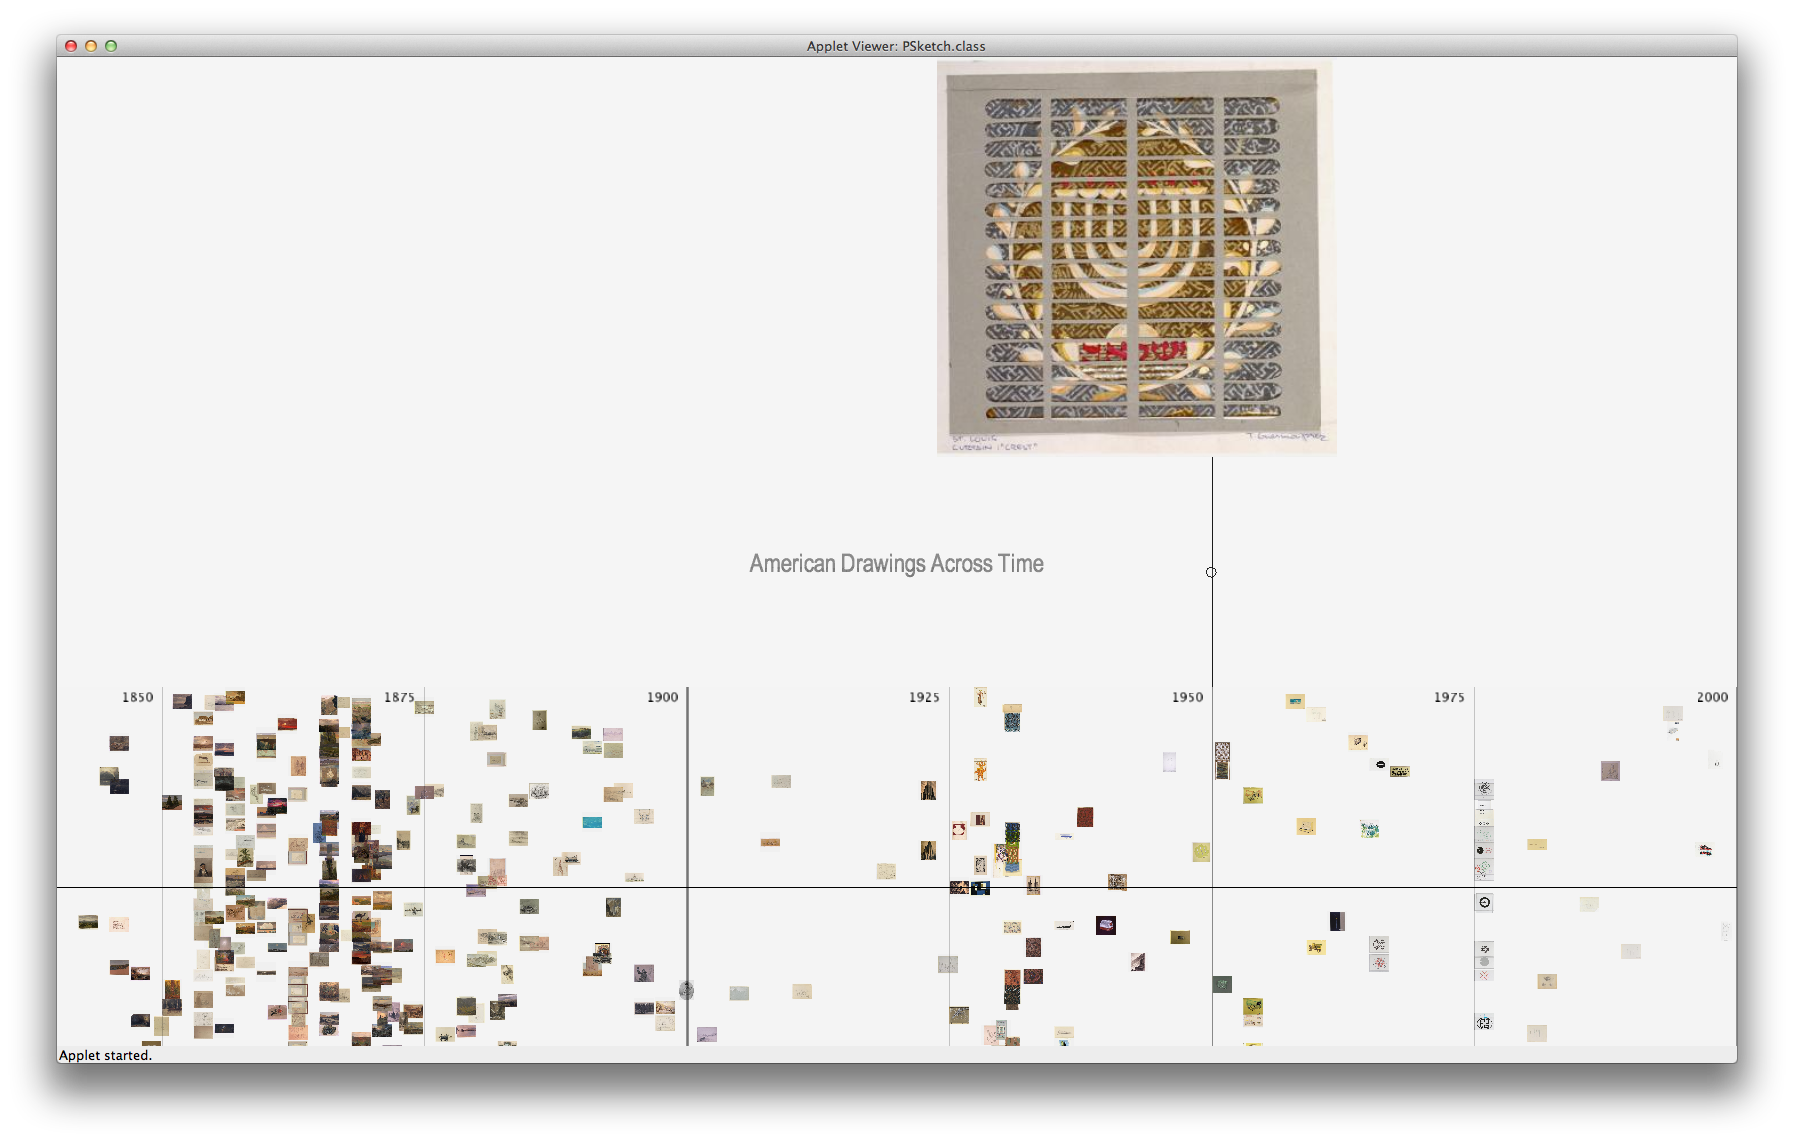
To optimize user-control over their movements, a limited time period was selected (from 1850 to 2000) after a much larger period was explored.
 [Figure. Detailed Banner Timeline. 10138 x 1121]
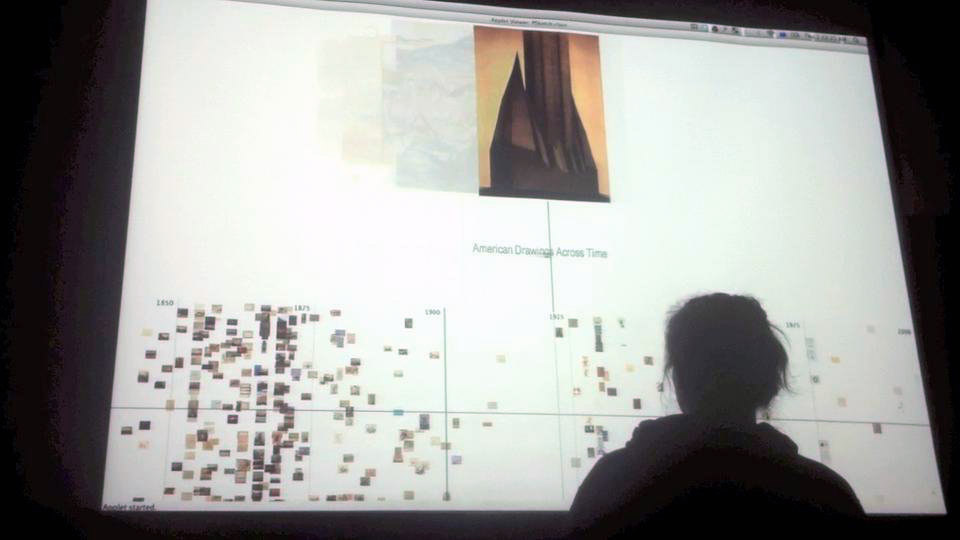
An installation was created that would showcase an artwork in time when someone was present based on their location. It even allowed for multiple users. This results in an installation where people can literally walk through time.

