COMP5048 Information Visualization (and Graph Drawing)
COMP5048 Information Visualisation was a course taught by Seok-Hee Hong, associated with the InfoVis group at the School of Information Technologies. Being a Computer Science, it was a very interesting algorithmic-focused complement to my understanding of Information Visualisation from the Design and Archaeology realms.
A student journal was retained throughout the course.
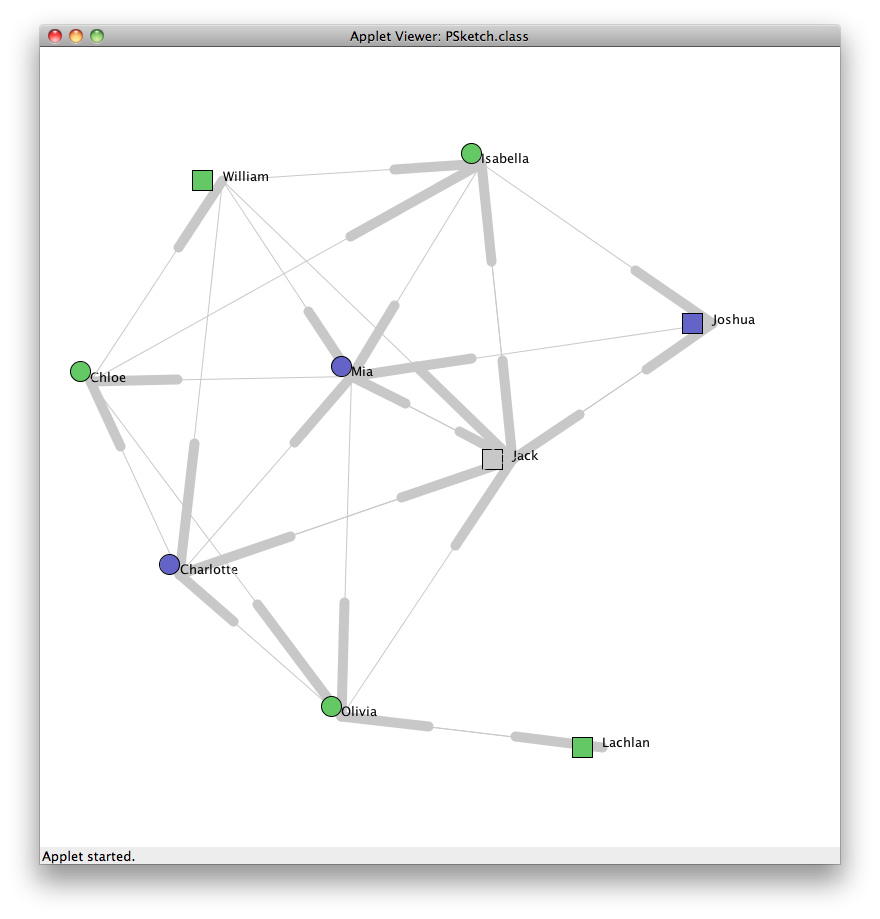
One of our early excercises involved the drawing of a small social network originally described as text. I elected to use Processing; beginning with automated force-directed methods, adding repulsion (Hooke’s law) and springs, coupled with manual tweaks to visuals.
In the final project, I teamed up with Adam Gawronski to work on a visualisation of University of Sydney Courses. Producing an interactive visualisation below:
As part of the full assignment report:
Notes for the final exam of COMP5048.
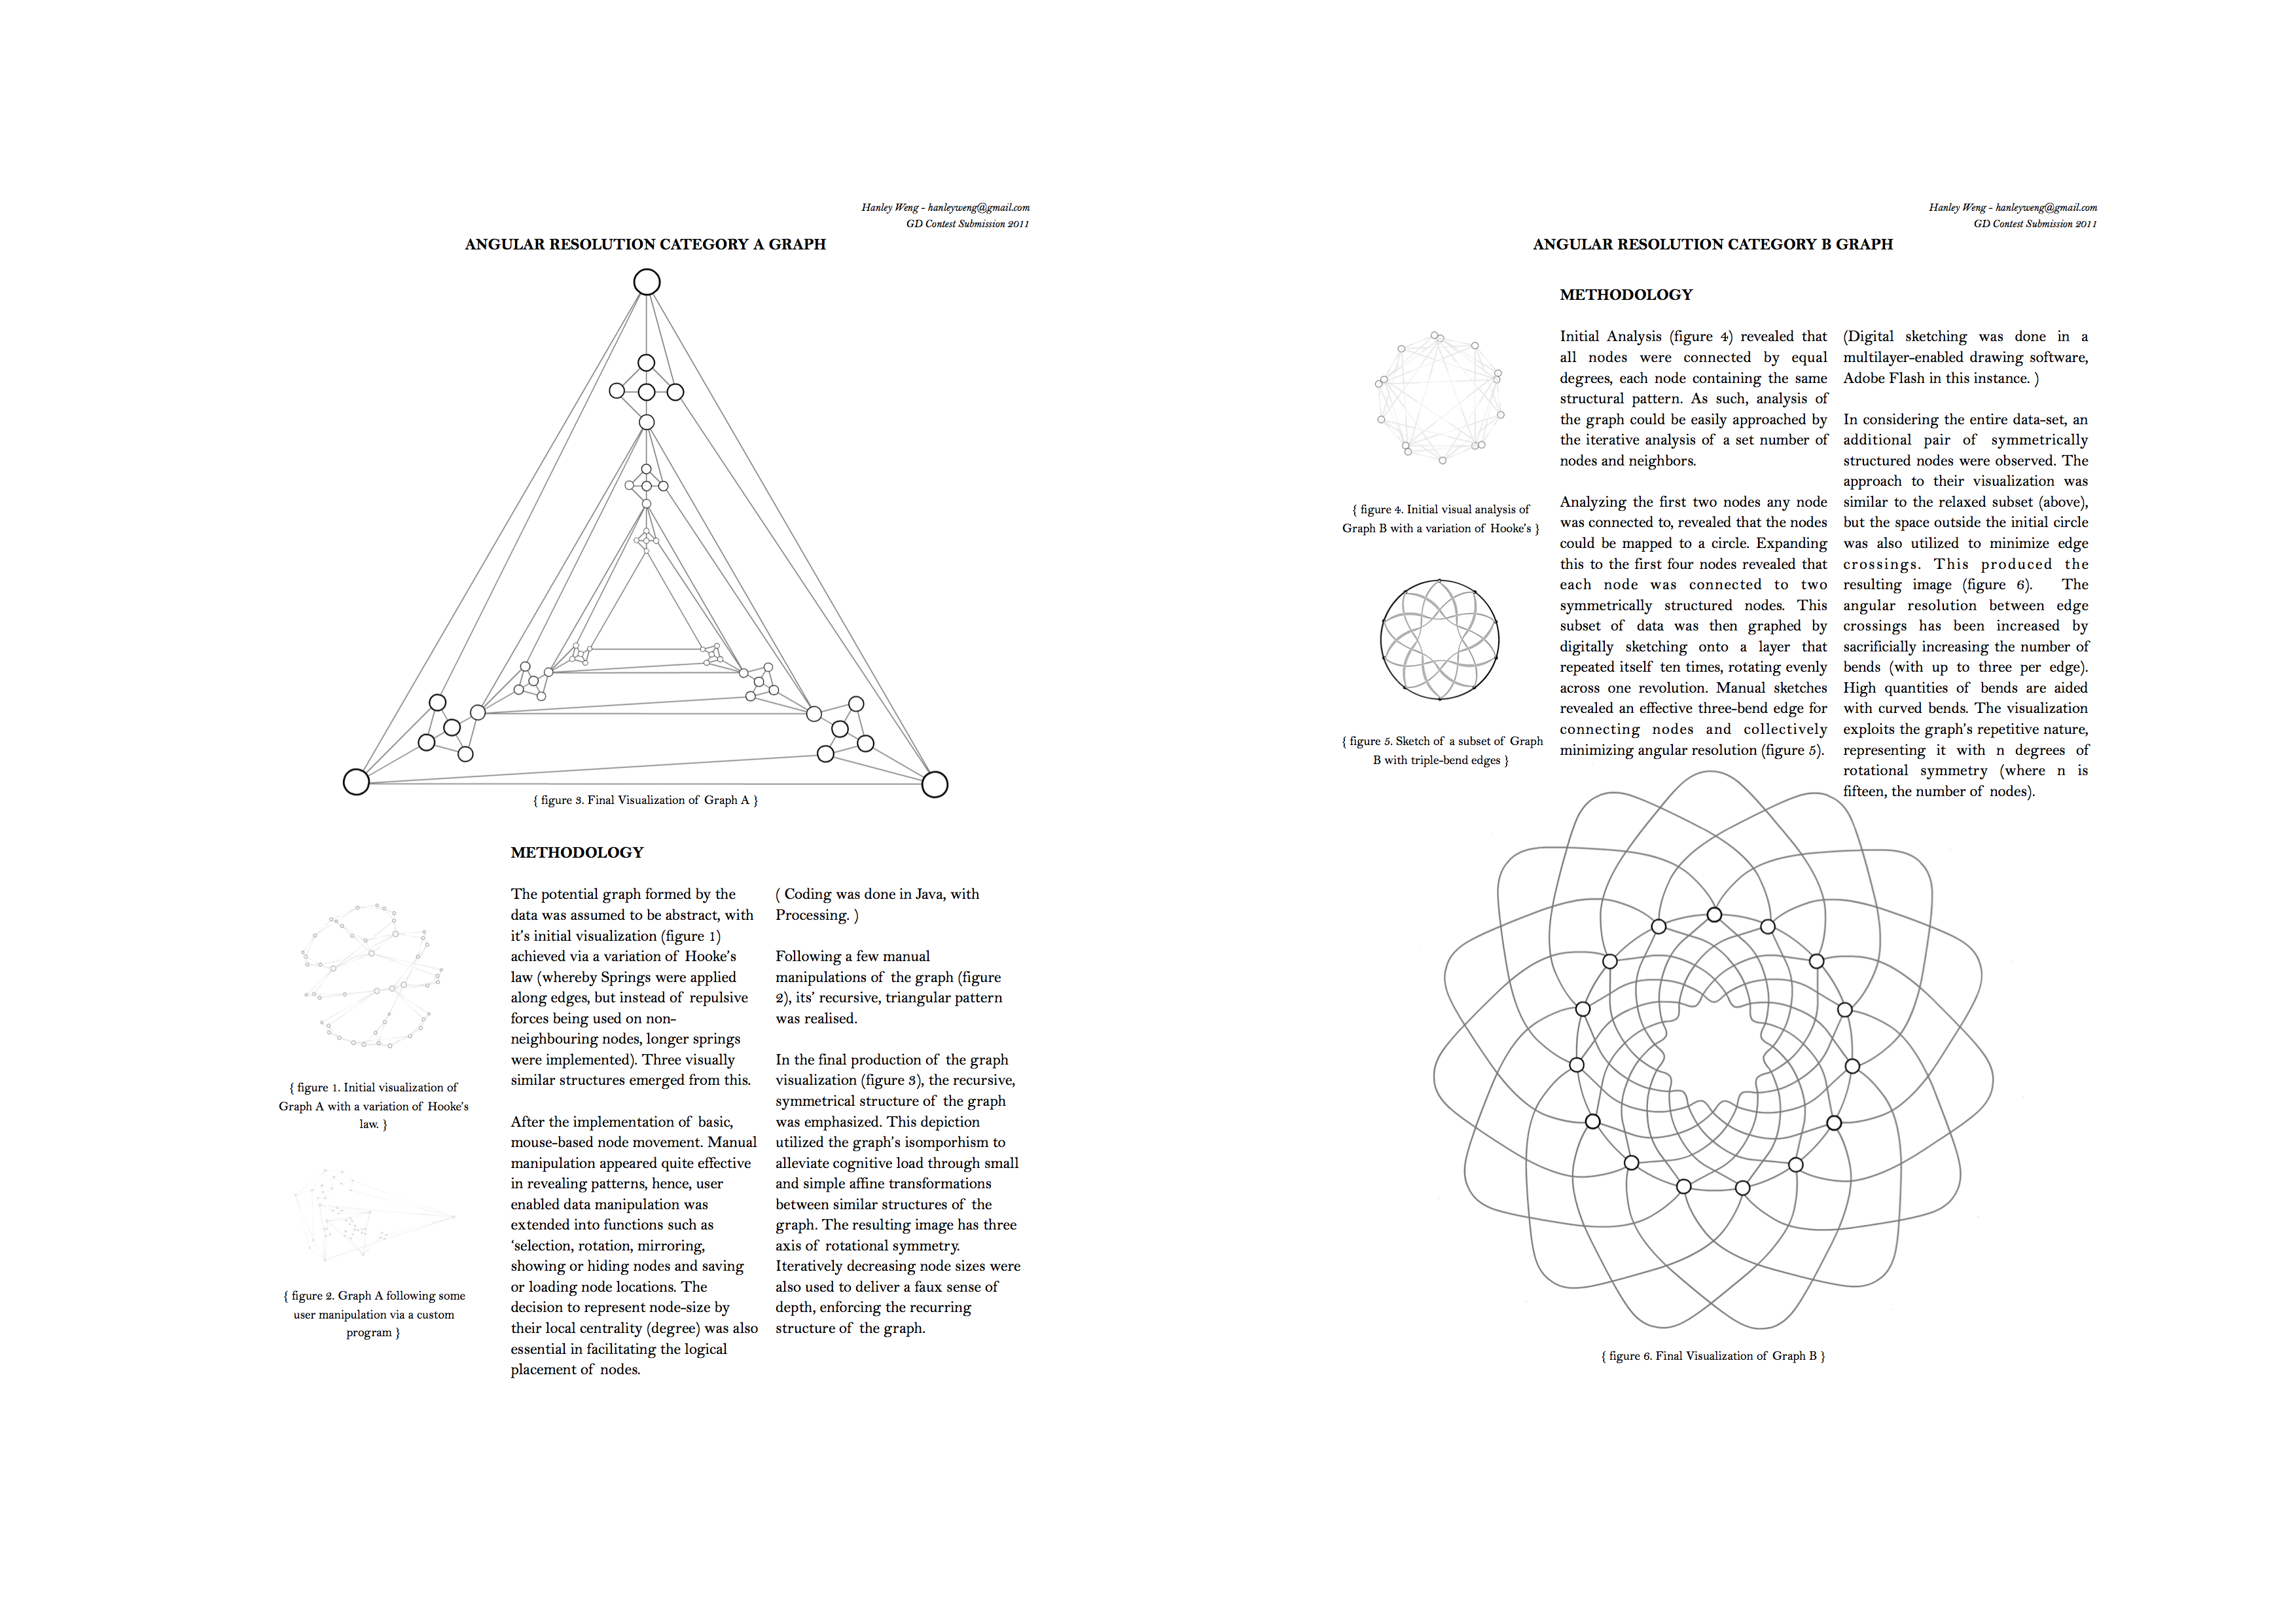
During the course, we were also encouraged to participate in the 18th Graph Drawing Contest, part of the International Symposium on Graph Drawing (GD).
A student report was written up of the proposed graph-solutions to the competition problems and their process.
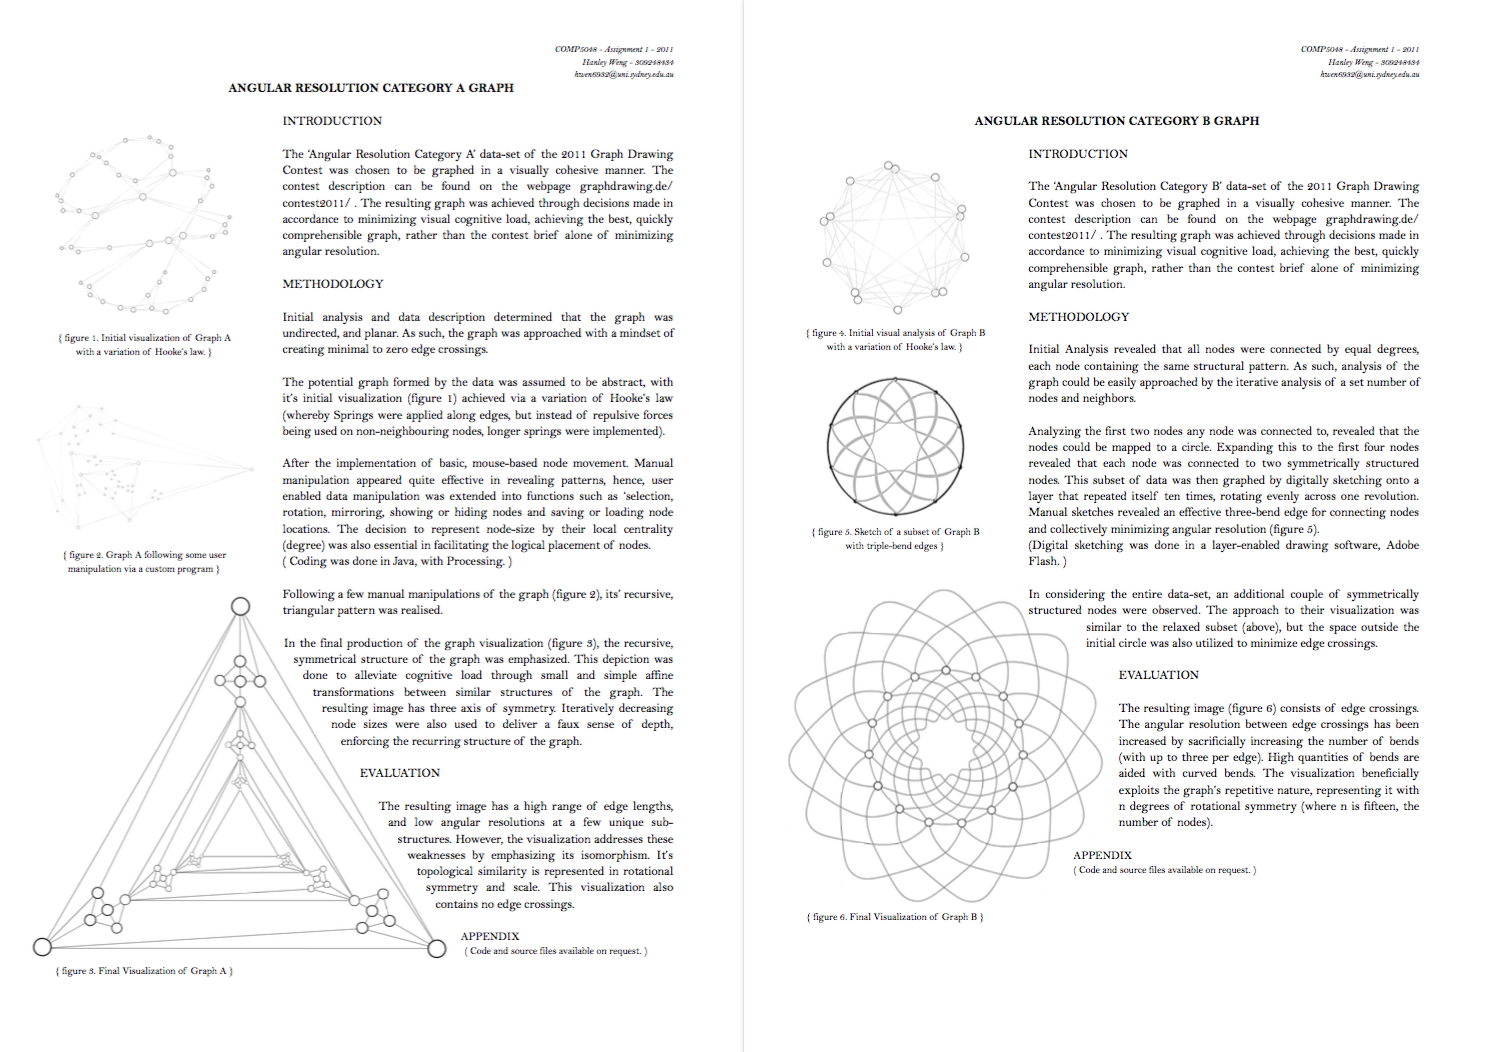
Graph A of the GD11 submission here won the ‘Straight-Line Planar’ segment of the Competition.
Overall a very insightful class, learnt much from the algorithmic computer-science perspective of Information Visualisation.