ARCA2606 - Maps, Time, & Visualisation (Course Summary)
About
Taking on an Archeology subject was a nice change of perspective from my usual courses in Design, Tech, and Arts. ARCA2606 ‘Maps, Time and Visualisation’, hosted by Ian Johnson and Andrew Wilson, The course taught me a lot on the historic subjectivity of maps, GIS tools, and in different appropriate methods for communicating spatial data through visualization.
Progression
Full progress can be found on my student blog for the course.
Note: The final post on the student blog above is a summary reflection of the course with images missing as I’d hosted them externally on Google Drive. (Mistake learned.) As such I’ve reproduced that reflection here.
Reflection: ‘maps. time. visualisation.’
This is a reflective journal entry and summary of the unit of study; ‘ARCA2606’, archaeology’s “Maps, Time and Visualisation” subject, taught by Ian Johnson and Andrew Wilson. It has been quite a practical course, with a nice mix of theory to support the exercises practiced. I have maintained an online student journal of my progress through this subject for personal documentation.
The class began by looking at an overview of mapping, it’s use and benefits, (of it and visualisation), over time. I learnt about the existence of different characteristics of represented data, from symbology to chosen map projections (‘Getting the hang of ArcGis’).
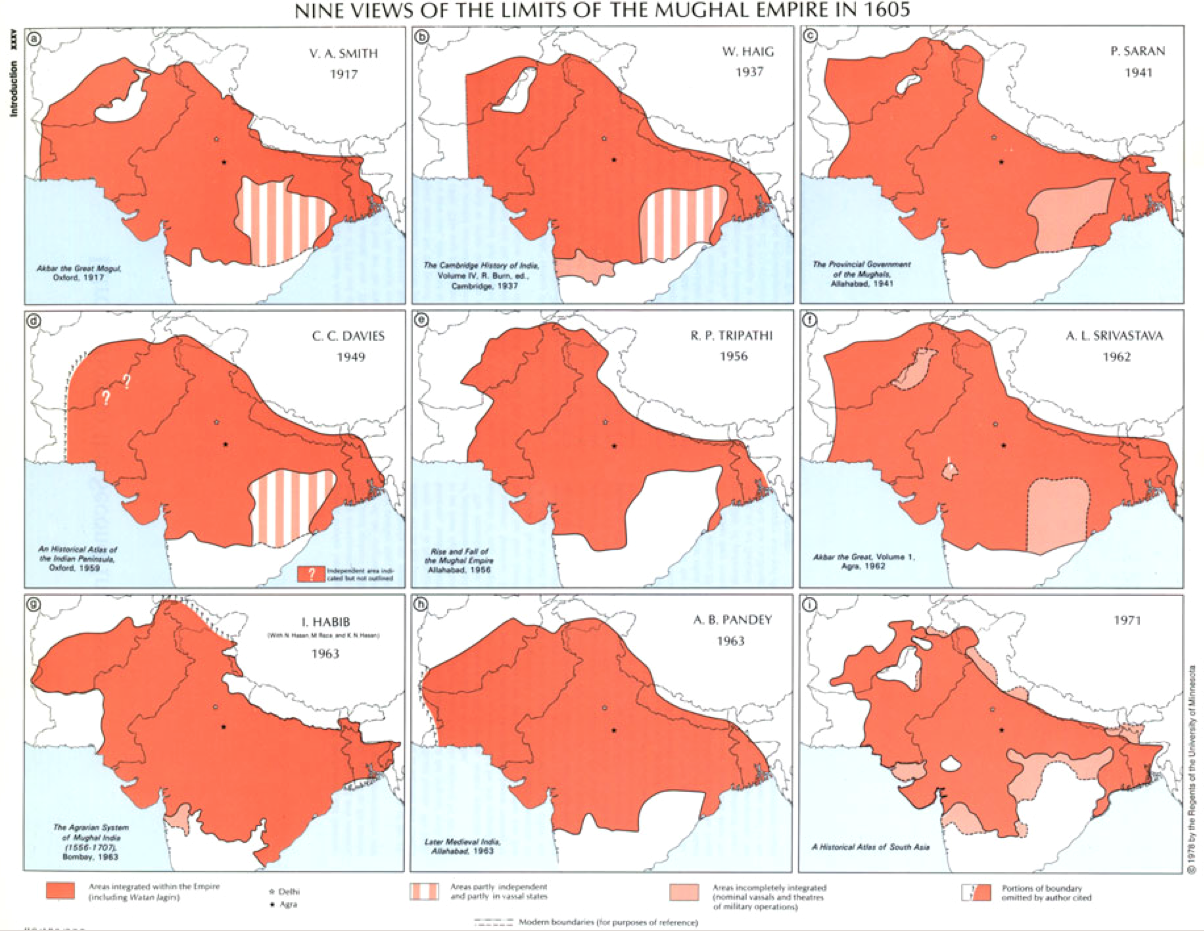
Over the first few weeks, the fact that “All Maps Lie” became much more apparent (especially through readings such as “Deconstructing the Map”, a paper by J.B. Harley, and a reading of Mark Monmonier’s “Lying with Maps”). A fact that is caused by maps’ subjective and contextual (historical, educational, political, religious, state-based) nature, and the reason why they should be treated as historical documents (‘Mapping the Past’). Likewise, uncertainty and technical errors were also present in historic maps, as can be seen in nine different views of the Munghal Empire in 1605.
Maps are pretty amazing, not only can they reveal stories, they can reveal so much about a culture, the map’s author, intended audience, and the context of the map’s creation (‘Mapping Historical Data’).
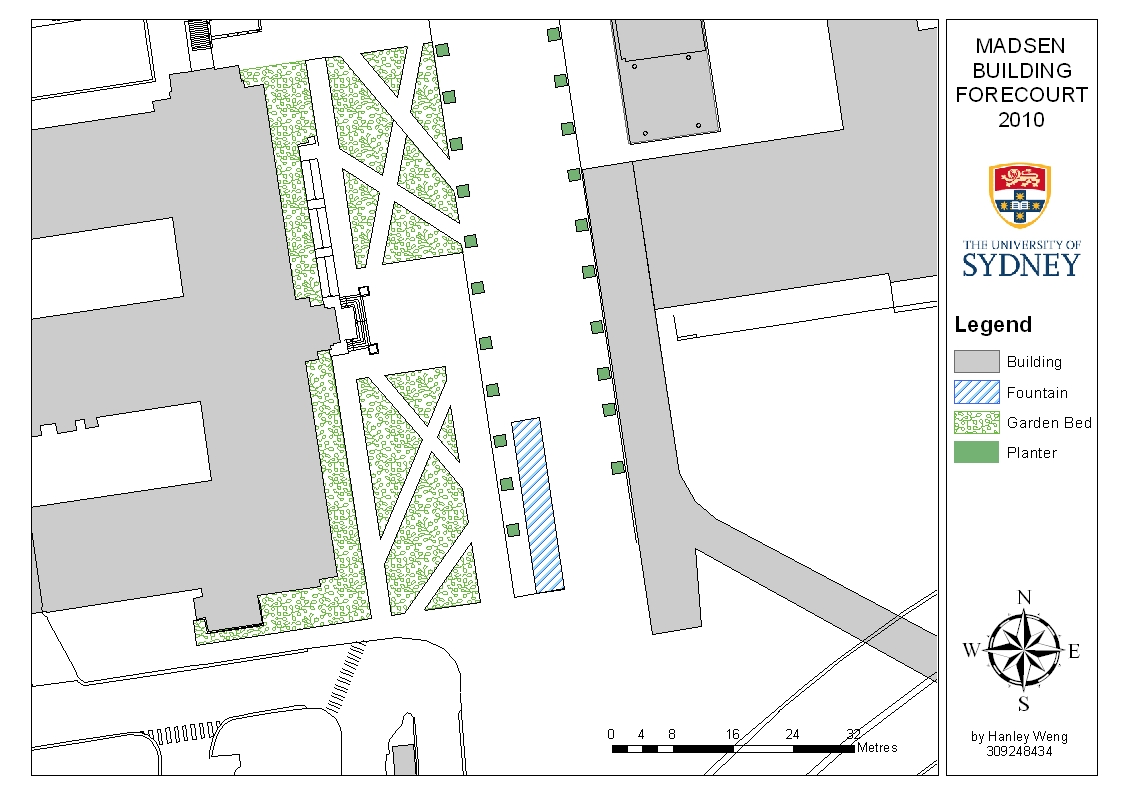
The nature of cartography was explored, classifying maps, and learning how to evaluate modern maps, along with their essential parts (such as scale, projection, symbolisation, orientation, key, title, etc.). The learning of such elements were augmented by our own (the student’s) initial drawings of the area in front of Madsen Entrance.
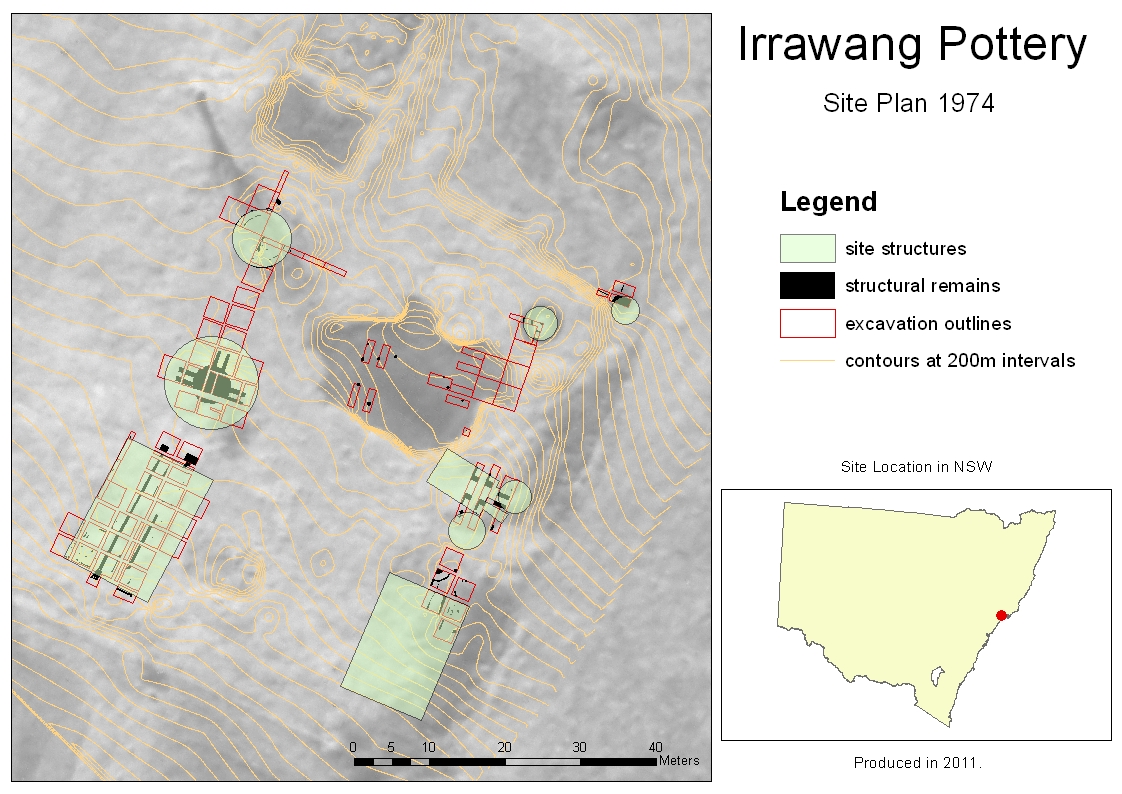
This same knowledge carried onto future excercises, such as maps depicting Irrawang Pottery Site.
Such weekly readings, lessons and activities were nicely supplemented by discussions such as “Why should we use an ‘incorrect’ map.”.
After exploring the core nature of cartography, Geospatial Information Systems (GIS) were examined. This type of software was very versatile, with growing and wide-spread use. It can essentially be sub-divided into three functions: a geo-database for storing, relating and querying geospatial data, a geo-visualisation tool for querying, modifying and showing features in relation to the Earth’s surface, and geo-processing – where new geographic datasets could be derived from existing ones. The importance of themes (layers) were emphasized, along with the difference of raster and vector data types. (‘What is a GIS?’)
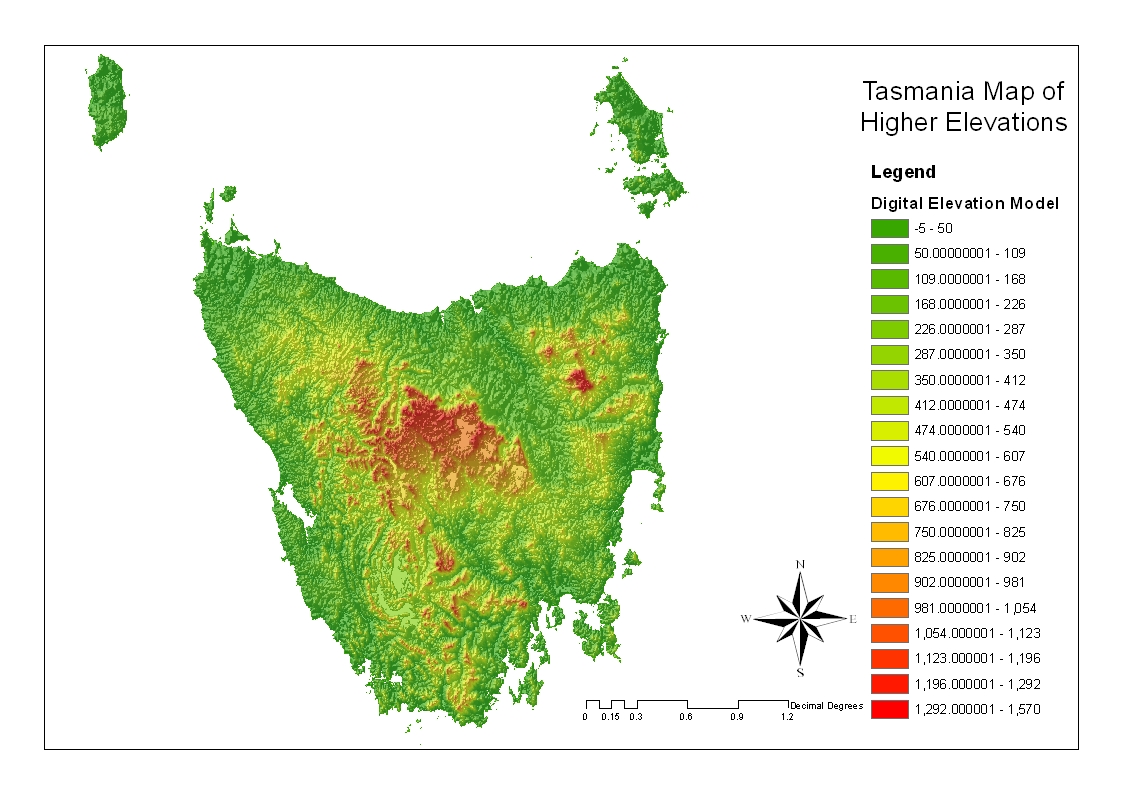
Layers in GIS are certainly powerful, aiding in the filtering of data sets to their most important information for a map, so knowledge can be derived from the map. As practiced in a mapping exercise.
Also covered were the many methods and techniques for collecting data for different uses, all with their own strengths and weaknesses. This data could be collected by oneself [] , or obtained externally ( ’Sources of Data’ ).
The various strengths and weakness of using free and open source data was also examined.
Different GIS types were explored (falling under proprietary or free-or-open-source GIS’), and I speculate we will see a rise in their use, but, at the consumer level, in much smaller and portable systems, with very different uses ( ‘Making maps gis types and speculated future’ ).
Historic drawings were also potential sources of data, but must also be viewed as historic texts. For example, paintings may add a house, to the original painting for aesthetic reasons.
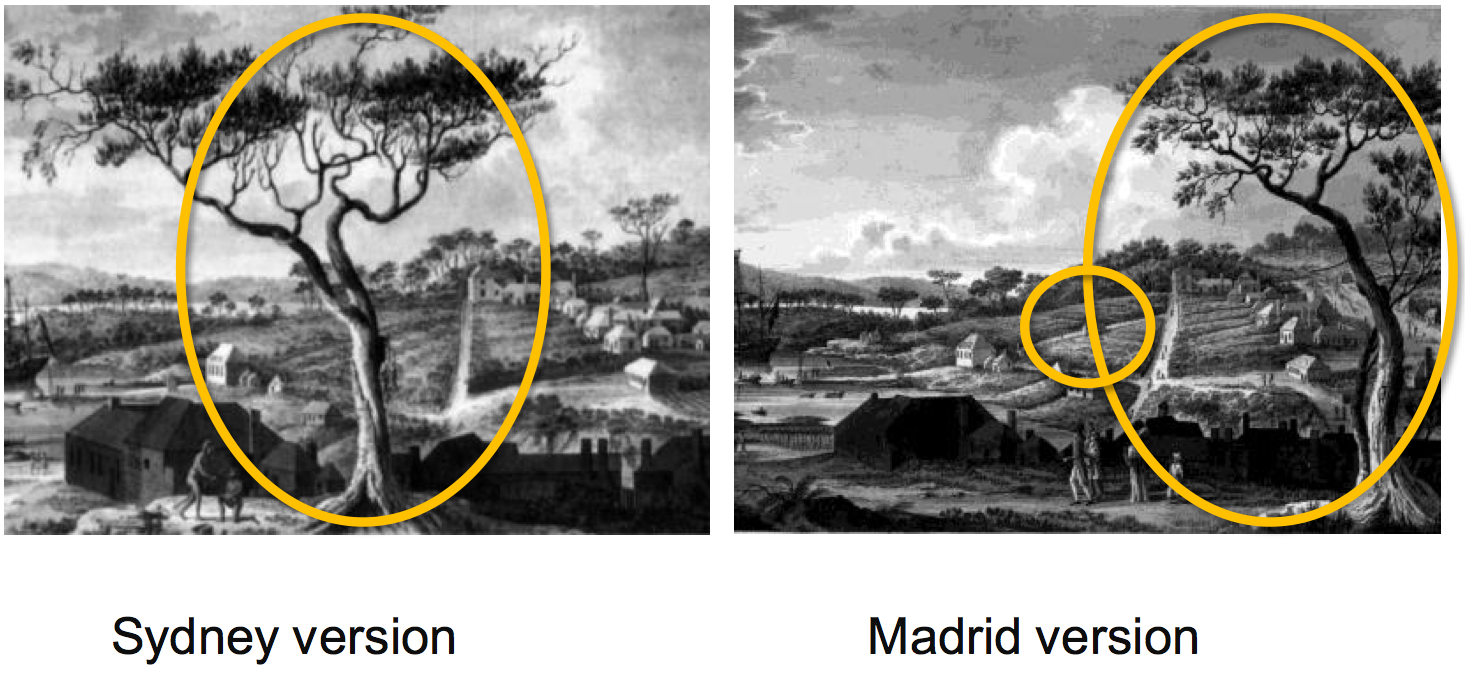
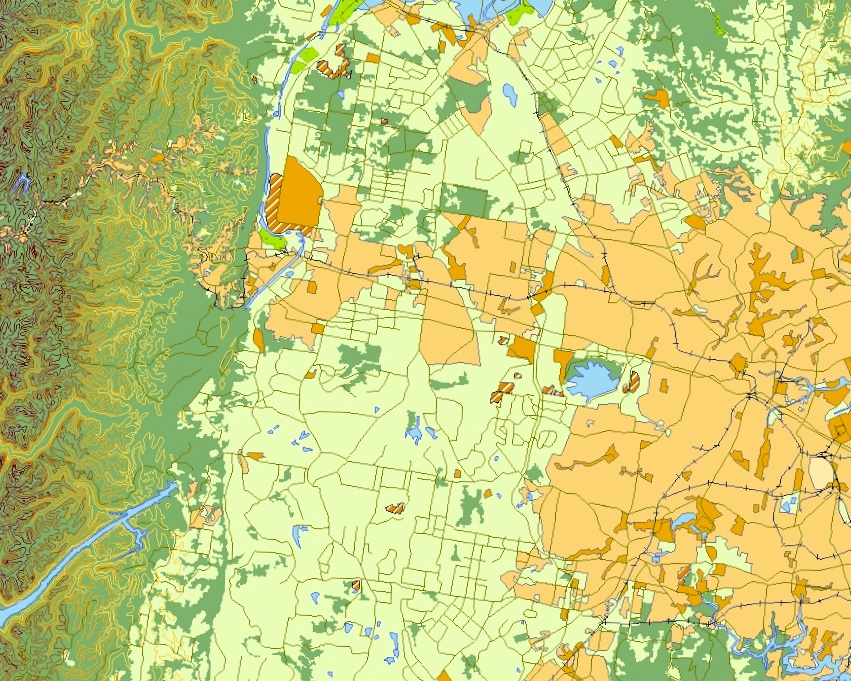
Along with the intricacies of historical drawings, we also learnt about various technical terminologies associated with GIS and geo-spatial data. ( ’Map Delivery’ ). Differences in historical drawings were observed in exercises that involved mapping them ( also called rubber-sheeting, or georeferencing) to existing geospatial points. Such mappings could be augmented in Google Earth showing additional values, building types and structures.
.png)
Case studies such as the reading: Indigenous Perceptions of Contact at Inthanoona, and other information ( ‘Usefulness of Digital Data Capture techniques during fieldwork’ ), revealed much on the process of collecting data at a site.
Different websites were also assessed for their presentation of information and interactivity.
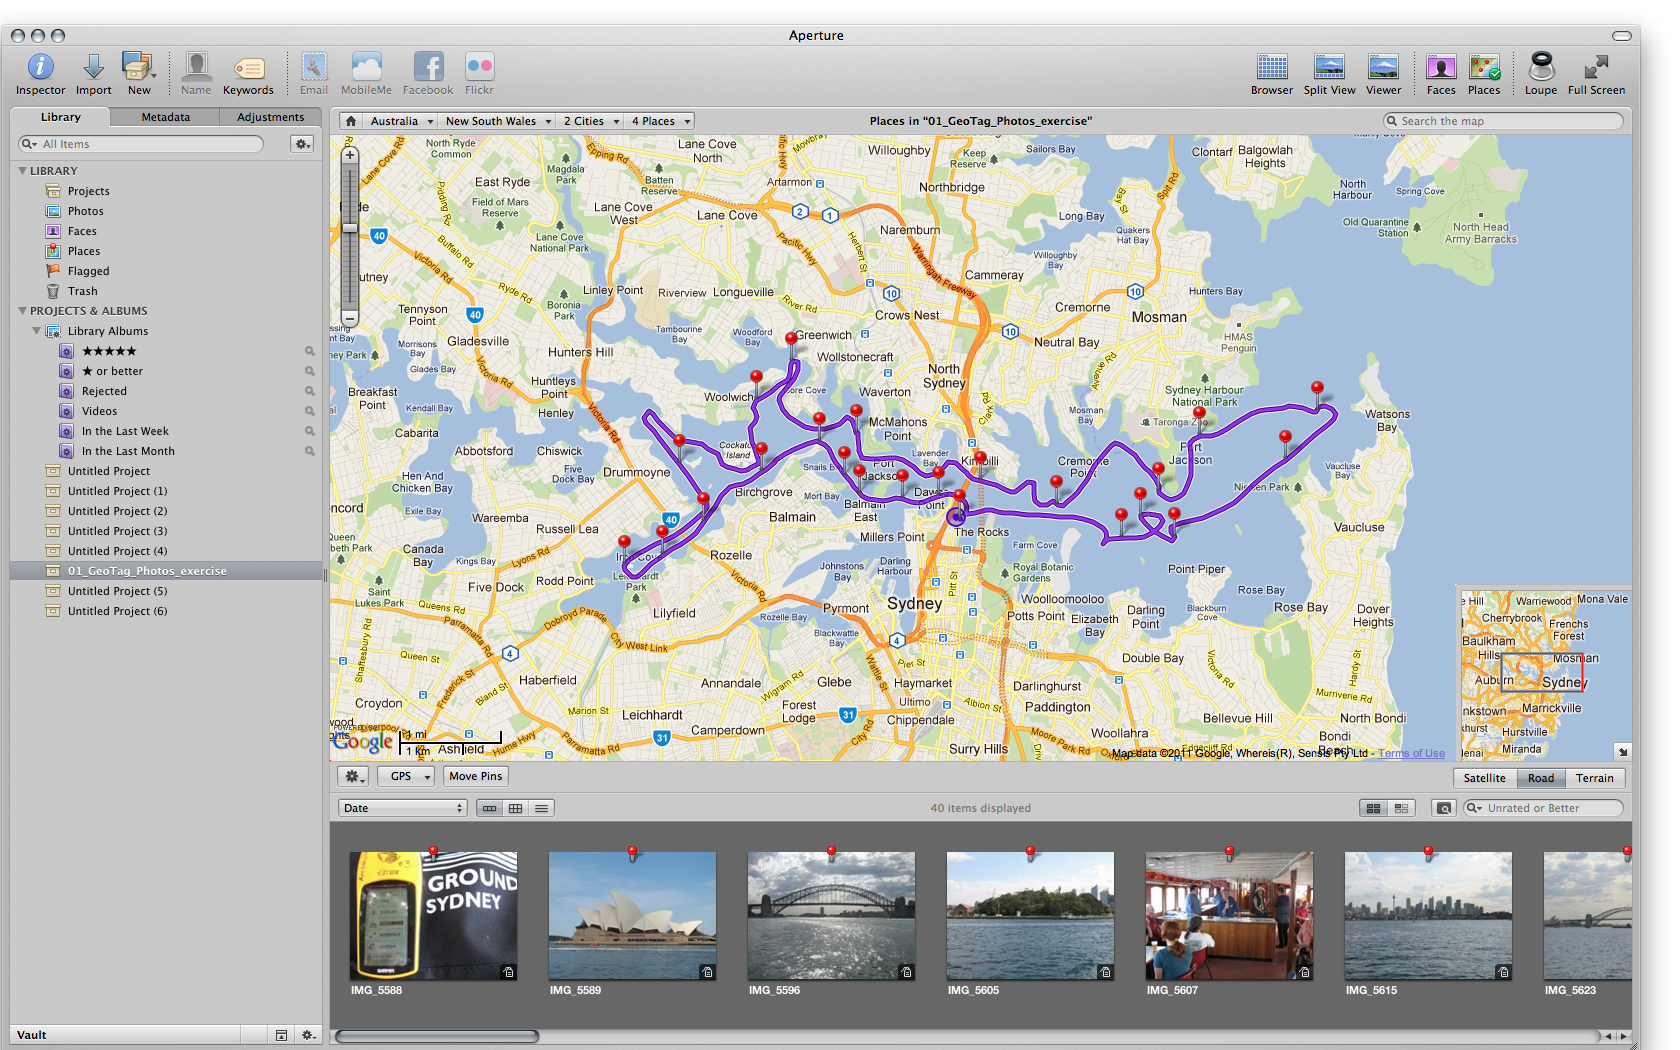
Techniques were explored for geo-tagging routes (which I found extremely useful and will definitely re-use in my travels), and rely on GNSS’ . We also handled data from total station surveys, transforming it into contour lines ( ‘Gathering Data Practice’ ).
After looking getting a grounded understanding on GIS, and a tonne of knowledge on the collection of data, ‘Time’ was next on the subject name (‘Maps, Time, and Visualisation’). This was quite an intriguing topic, as it is a type of data that is conveyed abstractly ( ‘Handling time’ ) and consequently has many different models.
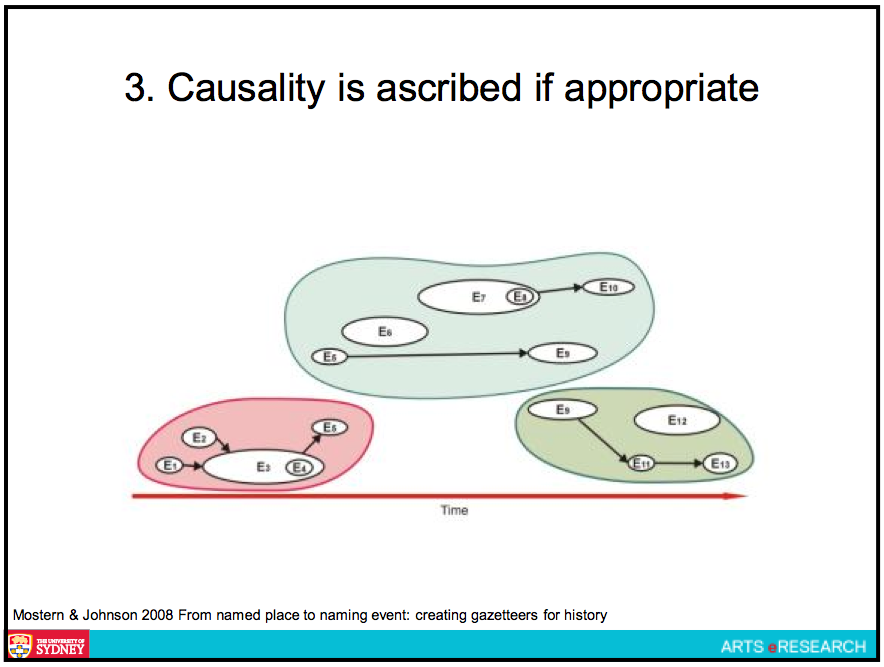
The reading on by Mostern & Johnson’s (2008) “From named place to naming event: creating gazetteers for history”, was extremely insightful, and provided a very nice event-based model (having events ordered by time, grouped into chronologies, and ascribe causalities). The Heurist tool also appears to emulate this model.
Visualisation was one of my favourite topics in this course, and one of the reasons I chose it, it was a shame there was only a lesson dedicated to it’s core and conception, but it was a good lesson, and there was a lot of content covered. The history of visualisation was interesting to learn, beginning as early as the 14th century with Nicholas Oresme. The matching of different data types with different visualisations was also extremely beneficial, and something that motivated further exploration ( ‘Importance of Data Graphs’ , ‘Exploring some Aussie Visualisations’ ). And, like clockwork, Charles Minard’s map was mentioned yet again (but it’s importance in representing the most important datasets across multiple dimensions was much better explained than in previous descriptions I have heard). ( ‘Nature of Visualisation’ )
After exploring the core ideals of visualisation, extra dimensions were explored , along with visualisations as simulations, and visualisations in websites, their content, and the user interaction design behind them.
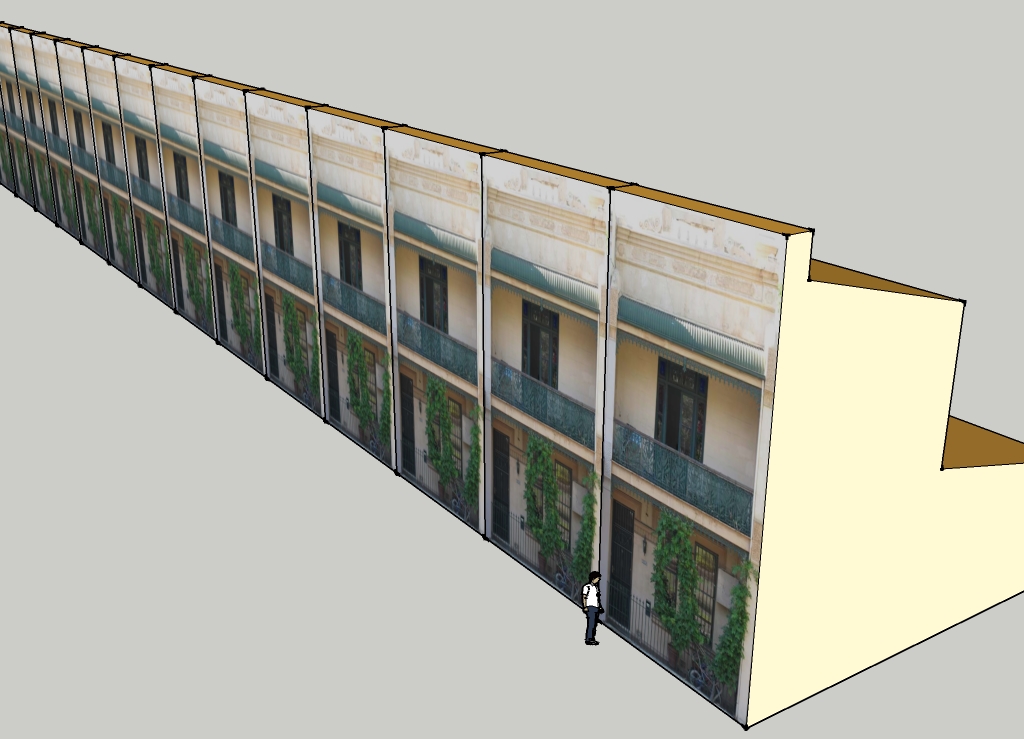
Activities related to visualisation included playing with google sketchup,
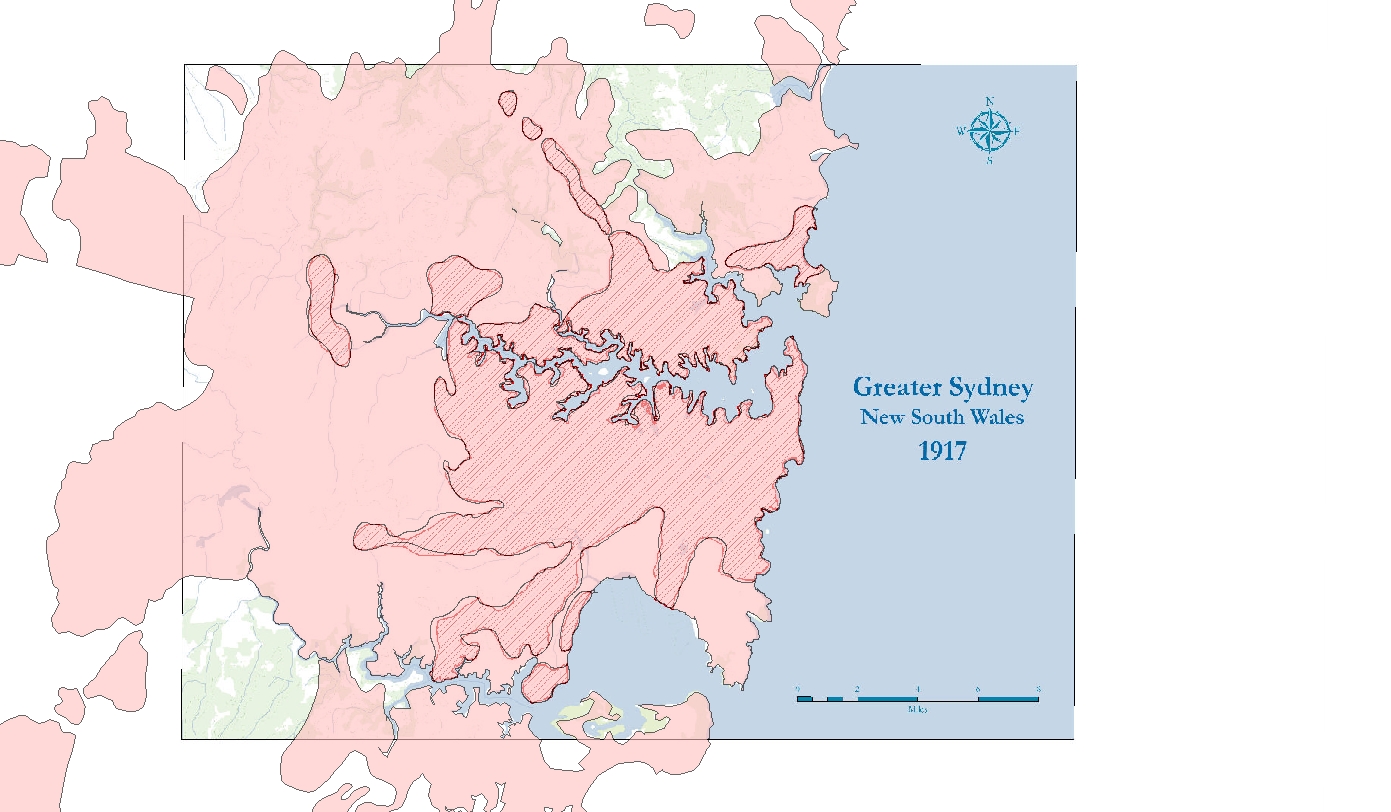
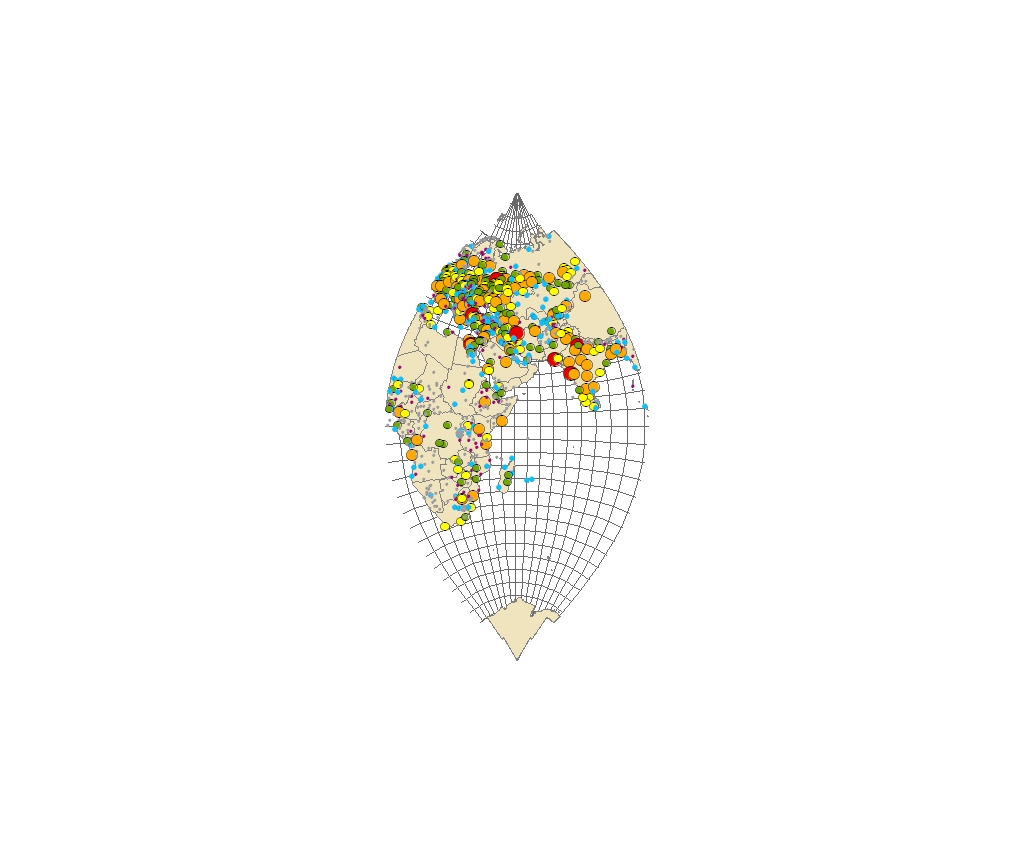
visualising Sydney Census Data,
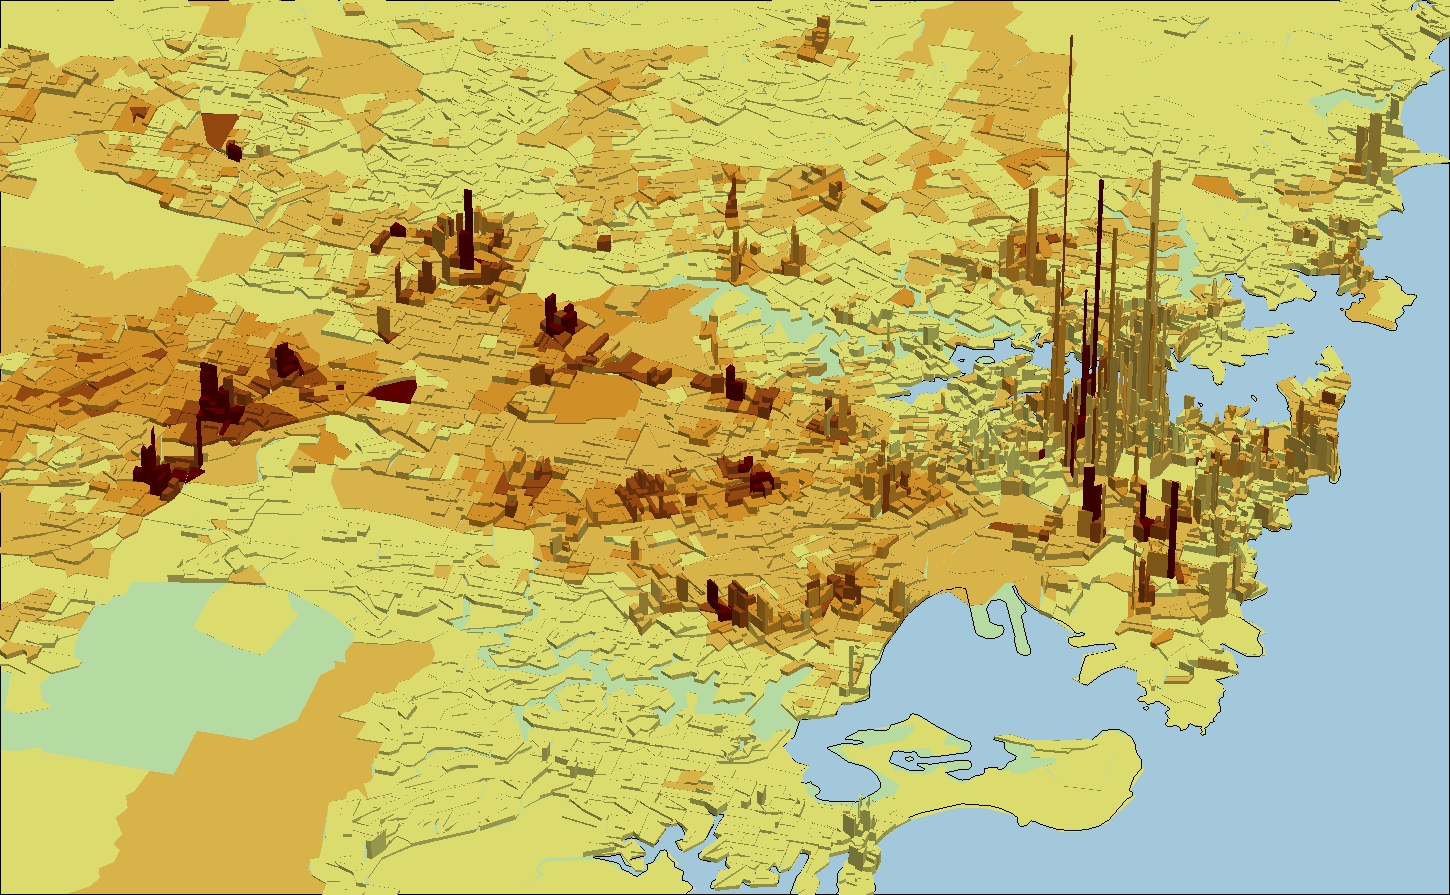 ( A visualisation mapping domestic and internationally-born populations )
and visualising temporal data.
( A video of urban growth in Sydney. )
( A video of Australian World Heritage Listed Sites. )
The management and issues of digital data was addressed, with a large note on recycling and preserving data through their digitisation.
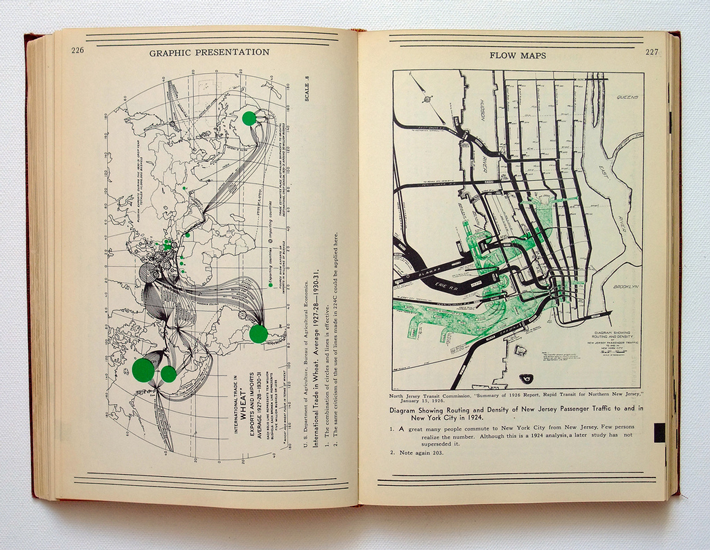
As the course progressed, I began noticing an increasing amount of content related to this area of study, most recently; Russia’s own GNSS, an article on how to better visualise and mapping social statistics ( ‘Mapping Social Statistics Dots’ ), processes of mapping ( ’To Map or Not to Map’ ) , and beautiful and historic visualisations (Willard Cope Brinston’s Graphic Presentation).
–
Appended Section on the Great Wall:
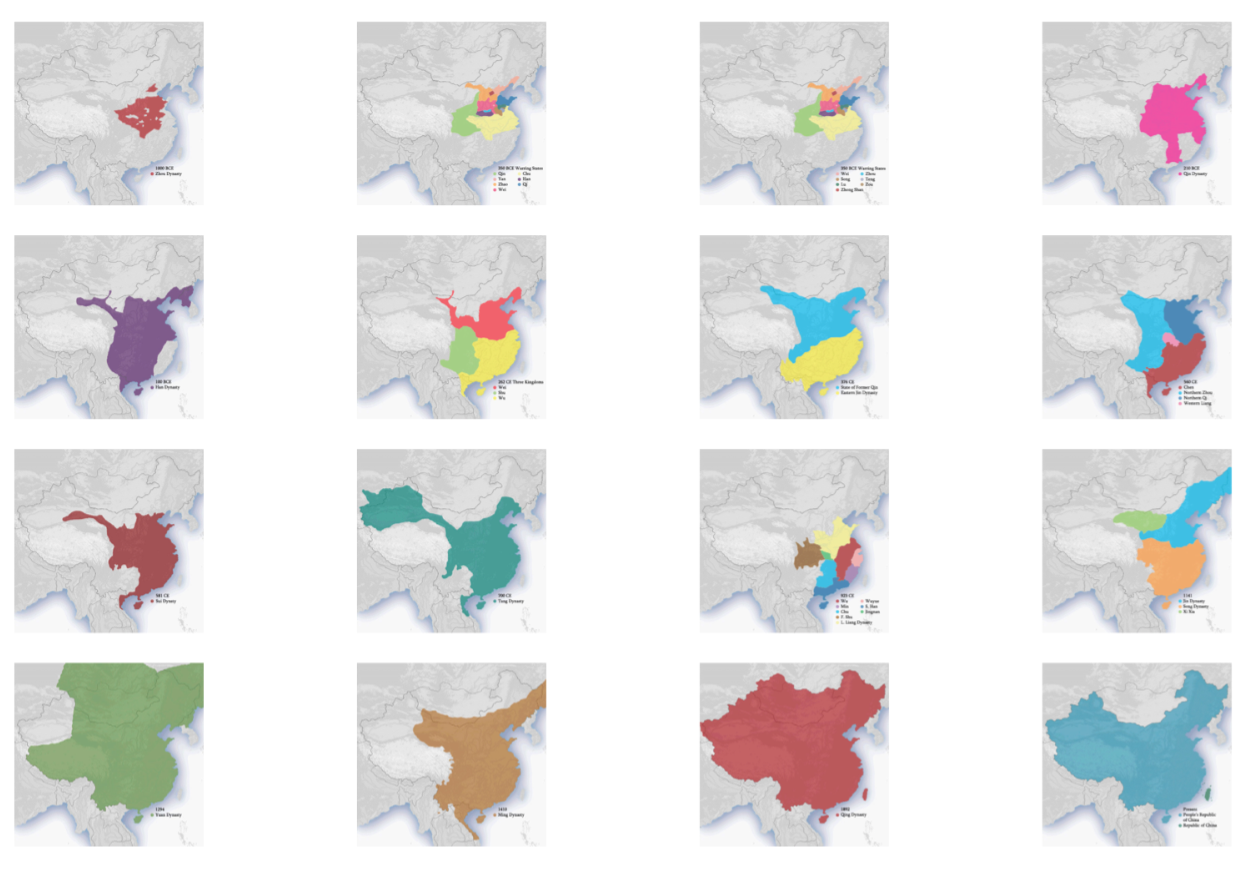
- Our final project involved the use of the ‘Heurist’ Geo and Correlation Oriented Database program, to input researched historical data and uncertainties in order to generate a report of a historical site. My report centred on the Evolution of the Great Wall.
–
Since this subject began, I have learnt much about maps, and my knowledge of visualisation, and the intricacies of mapping time have been augmented. From lying about maps to the nature of visualisation, from cartography to GIS’ and data collection, this has been a very insightful journey.