Brain Network Visualisations
I recently had the chance to play with and visualise some brain coactivation network data.
This was for the paper: Resilience of human brain functional coactivation networks under thresholding by S. Sarkar, S. Chawla, H. Weng
There were many cool looking visualisations, and some insights, formed from the mapping of certain network metrics to the network of coactivating nodes representing the brain.
Process Snapshots
Tools used included the network visualisation tool – Gephi, and augmenting my own custom Java application for 3D network visualisations. After Effects was used for compiling animations, and Numbers, Sheets, Excel, Python, R, Matlab, Java were utilised in processing data.
The following are some of the images and animations of the brain coactivation network that were rendered during its investigation.
For those interested, I’ve annotated the content below with Graph / Network-Theory terminology. Most metrics are Centrality based.
During the early process of visualising this network, I applied a simple spring-layout algorithm to the network (‘Force Atlas’), interestingly and amazingly enough, the network began to resemble the side view of the cerebelum! Suggesting the topological aspects of the network reflect their physical structure!
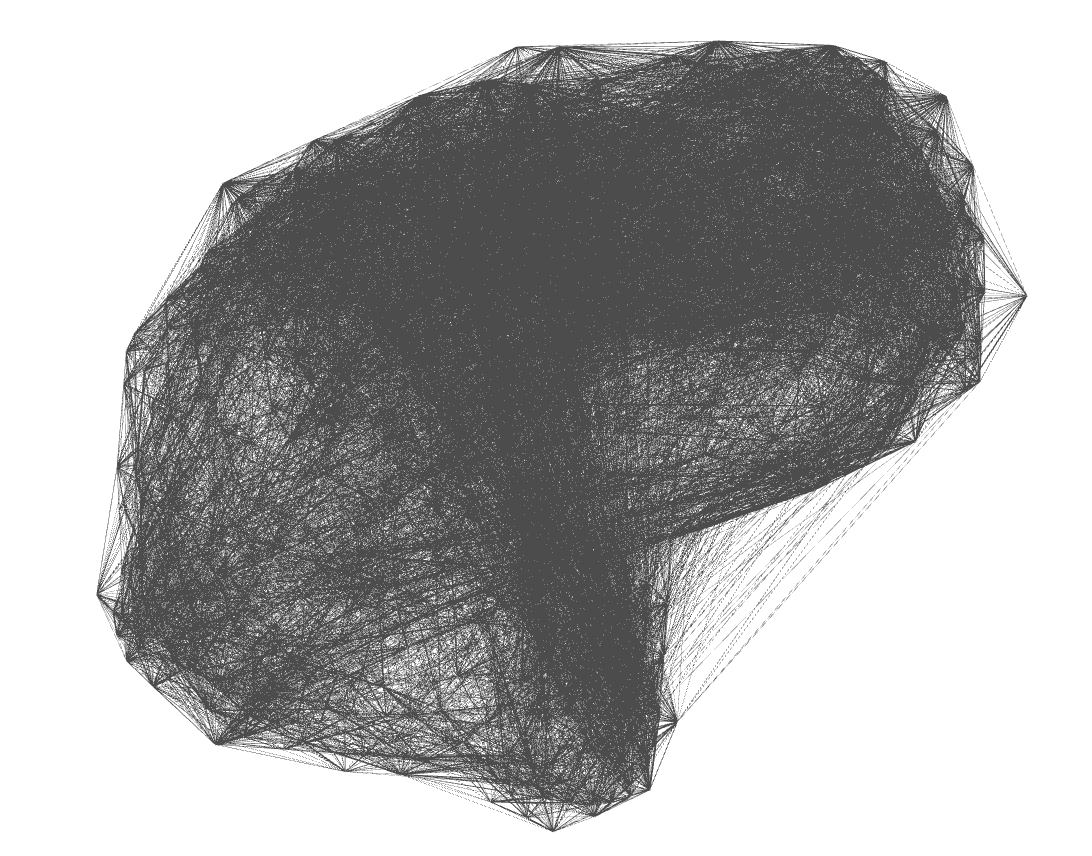
Force Directed Network with increasing Minimum Edge-Weight Threshold:
.gif)
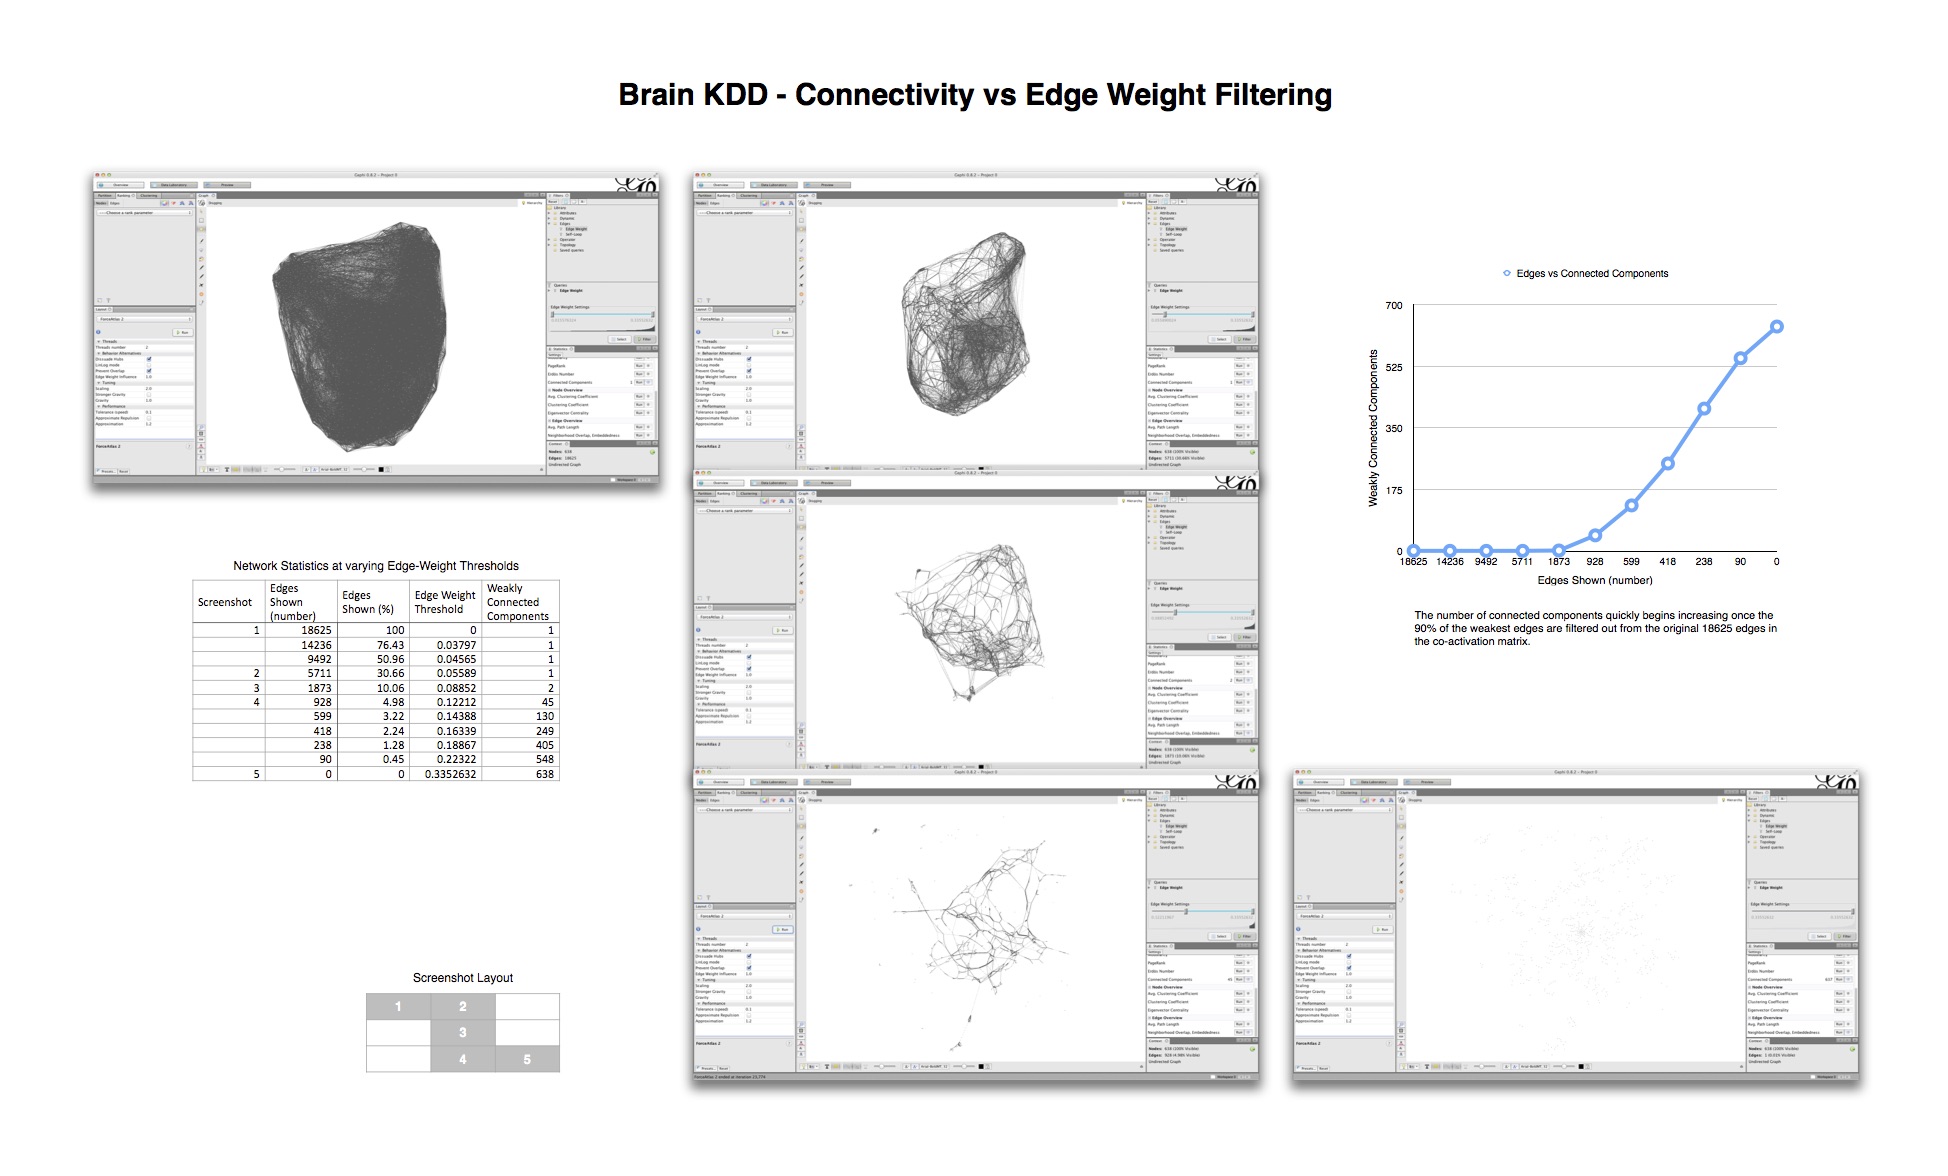
Continuing with explorations in ‘increasing Minimum Edge-Weight Threshold’, these are its effects on:
Degree Centrality:
 Betweenness Centrality:
 KShell:
KShell (node color) and Betweenness Centrality (node size):
Exploring ‘decreasing maximum edge-weight threshold’ of the co-activiation network:
Triptic from back, top, side view of brain, with KShell (node color) and Betweenness Centrality (size):
Here mapping Modularity/Community (t3) (node color) and Degree Centrality (node size).
Additional higher-resolution content can be found on these unlisted youtube playlists:
- #2 Increasing Miniminum Edge-Weight Threshold
- #3 Decreasing Maximum Edge-Weight Threshold
- #4b 3D Coordinate Renders
- #8 Final Collection of Renders
The paper can be read on arxiv: Resilience of human brain functional coactivation networks under thresholding.
Abstract
Recent studies have demonstrated the existence of community structure and rich club nodes, (i.e., highly interconnected, high degree hub nodes), in human brain functional networks. The cognitive relevance of the detected modules and hubs has also been demonstrated, for both task based and default mode networks, suggesting that the brain self-organizes into patterns of co-activated sets of regions for performing specific tasks or in resting state. In this paper, we report studies on the resilience or robustness of this modular structure: under systematic erosion of connectivity in the network under thresholding, how resilient is the modularity and hub structure? The results show that the network shows show strong resilience properties, with the modularity and hub structure maintaining itself over a large range of connection strengths. Then, at a certain critical threshold that falls very close to 0, the connectivity, the modularity, and hub structure suddenly break down, showing a phase transition like property. Additionally, the spatial and topological organization of erosion of connectivity at all levels was found to be homogenous rather than heterogenous; i.e., no “structural holes” of any significant sizes were found, and no gradual increases in numbers of components were detected. Any loss of connectivity is homogenously spread out across the network. The results suggest that human task-based functional brain networks are very resilient, where the whole network structure fails only when connectivity is almost fully removed from the network. The findings may help further the understanding of dynamics of and relationships between structural and functional brain networks.